RockWorks | Borehole Operations | T-Data | Profile
Use this program to:
- Create a new 3-dimensional solid model (an .RwMod file) representing your downhole time-based interval data
- OR -
Read an existing .RwMod file you've already created.
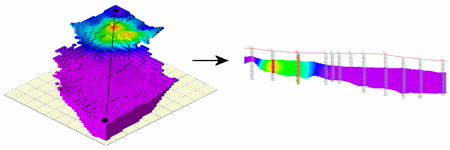
- Slice this model between two points and create a 2D profile diagram. Because the T-Data model is interpolated across the entire project, you can place the profile slice anywhere you like within the model space.
The profile panels can be color-coded in a variety of ways, and 2D striplogs can be projected onto the profile with true orientation maintained. Faults, surface profiles, infrastructure, and other layers can be appended to the diagram. The completed T-data profile will be displayed in RockPlot2D.
See also
T-Data Sections, T-Data Projected Sections
Feature Level: RockWorks Standard and higher
Menu Options
Step-by-Step Summary
Tips
- Rules & Filters: Use the buttons at the top of the window to apply filters and rules for this program. (More info)
- Spatial Filter: Filter the input data for the T-Data model based on XYZ location, filter the data to be displayed in striplogs, if activated. Note that these tools filter the data that is passed to the modeling and log-generating procedures. This is distinct from the filters that are applied once the model is completed, and described below.
- Time Filter: Check this item to model your T-Data measurements for a specific date or range of dates. If you leave this un-checked the program will model all of the measurements, for all listed dates, in a single model. (If you have entries for different dates for the same depth intervals for your wells, leaving the date filter off may not make much sense.)
- Exact: Click in this button if you wish to enter a specific date for the measurements to be modeled. Enter into the prompt or choose from the calendar the specific date. During modeling RockWorks will process the T-Data measurements for the selected track that fall on this date.
- Range: Click in this button if you prefer to enter a beginning and ending date to define the range of dates to be included in the model. Type the dates into the Start and End prompts or pick dates from the calendar. During modeling RockWorks will process the T-Data measurements for the selected track that fall within this date range.
- Stratigraphic Rules: Apply stratigraphy rules for Stratigraphy data in striplogs, if activated.
- 2D Log Design
Click here to choose which data items are to be displayed in the logs, if activated via the Striplogs checkbox below, and in which order. See Using the 2D Log Designer and the Visible Item Summary.
! For Profile diagrams, striplogs will be projected onto the line of section; you'll be able to select the distance from the profile cut within which logs will be "grabbed" for display in the diagram. See Multi-Log Profiles for information.
! Deviated/inclined boreholes can be displayed with true geometry on the profile.
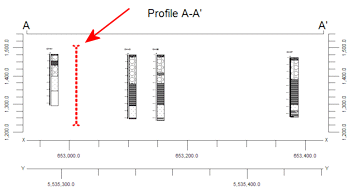
- Profile Location
Click on this button at the top of the window to draw or import, on a map display of your enabled boreholes, where the profile cut (or multiple cuts, if you've requested parallel profiles, below) is to be placed. The most recent profile drawn for this project will be displayed. (More info)
- Location Map
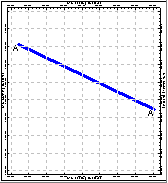
Check this box to create, along with the profile, a reference map that shows the profile cut's location. It can be embedded in or created separately from the profile.
Click on this tab to establish the map options. (More info.)
- Faulting
Click on this tab to enable the display of faults and to modify fault options. (Read this for more details.)
- Vertical Exaggeration
Click here to pre-define the vertical stretch you would like to apply to your diagram. By giving the program this information in advance of generating the profile, it can help with text and graphic sizing and placement. (More info.)
! Note that you can always change the vertical exaggeration at which the diagram is displayed, in the RockPlot2D window itself. But, by telling the program up-front how stretched it will be, you'll get better placement of the graphic components.
- Model
Click this tab to define whether you wish to use an existing solid model (from a previous use of this tool or another T-Data menu tool) or you wish to create a new solid model and set the modeling options.
! NOTE This is not trivial. Creating the solid model can take some time, depending on the resolution of the model and the detail of your data. If you already created a pleasing model for display as a fence diagram, for example, you can use the same model, which was stored on disk as an .RwMod file, for the profile.
- Create New Model : If you want to create a new solid model to be represented in the profile diagram, click in this radio button, and use the tabs to the right to establish the modeling settings.
- T-Data Input
- Track : Click on this item to select the track or column in the I-Data tab that is to be modeled. The names displayed in the list will be pulled from the column headings.
- G-Value Filter : Activate this option to establish a data filter based on the measured values (geochemistry, etc.). Click on this tab to establish the filter parameters. (More info)
- Resample : Check this box to resample the data and click on the tab to establish the resampling options. (More info)
- Solid to be created : Click to the right to enter a name for the I-Data model. The program will append automatically the file name extension ".RwMod".
- Algorithm: Click this tab to select the modeling method to use, for interpolating your T-Data model. (More info)
- Special Options: Click on this tab to establish other model settings, such as tilting, warping, filtering above-ground, and smoothing. (More info)
- Dimensions: Click here to establish the output dimensions of the solid model. (More info)
- Use Existing Model
Click in this radio button if you wish to use an already-existing solid model of your interval data, to generate the profile diagram.
Click on this tab to specify the name of the existing model.
- Solid Model : Click to the right to browse for the name of the existing existing solid model (.RwMod file) to be used for this profile diagram.
- Contours
Click this tab to access the panel appearance settings.
- Colored Intervals: Check this item to display G-value distribution on the profile panel with color-filled intervals. Click this tab to access the color contour settings. (More info)
- Contour Lines: Check this item to include G-value contour lines on the profile panel. Click on this tab to access the contour settings. (More info)
- Striplogs
Check this item to include 2D logs with the profile display. Click the 2D Log Design button at the top of the window to set up how you want the logs to look. Click on this tab to establish some additional striplog settings.
- Clip: Check this box if you want to display a subset of the log data. Click on the tab to define the elevation range to be displayed.
- Top Elevation: Enter the uppermost elevation to be displayed in the logs.
- Base Elevation: Enter the lowermost elevation to be displayed in the logs.
! Log clipping parameters are defined using elevations, not depths. (More info.)
- Save Log List: Check this to save to a text file the names of the boreholes that are included with the profile diagram.
- File in which to store the Log List: Enter the name for the log list text file.
- Display List Upon Completion: Check this to display the text list in Notepad (or equivalent) after the profile is completed.
- Collar Distances: Check this box to display at the top of the profile a series of labels that represents each borehole's distance to the profile line. (More info)
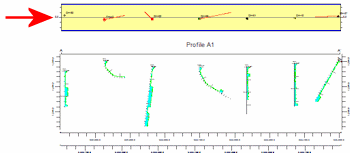
- Stripmap: Check this item to include a stripmap above or below the profile diagram, which depicts the position of the logs within the search "swath" relative to the profile.
Click on this tab to establish the Stripmap location and appearance options. (More info)
- Annotation
Click on this tab to establish title, border, axis labels, and other perimeter settings for the profile. (More info.)
- Surface Profile
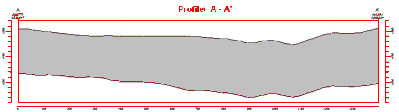
Check this box to include a polyline on the profile diagram that represents a user-selected elevation grid model, such as the ground surface or a water level surface.
Click on this tab to access the surface profile options.
- Grid Model: Browse for the name of the existing grid model (.RwGrd file) to be represented in the polyline.
- Polyline Attributes: Click this tab to establish the line settings. (More info.)
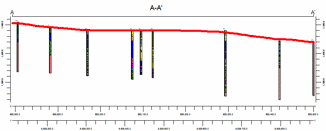
- Faults
Check this box if you want to display vertical lines in the output diagram where the section slice intersects the fault(s) defined in a project Faults Table.
Click on this tab to set up the fault lines. (More info.)
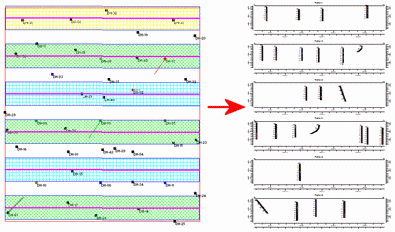
- Parallel Profiles
Check this box if you want multiple profile lines to be drawn automatically, offset from the profile that you define.
Click on this tab to define the direction and spacing of the automatic profile lines, the maximum distance, and diagram labeling options. (More info.)
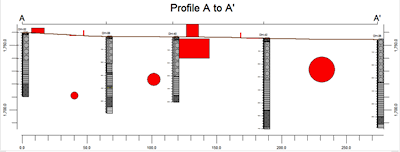
- Infrastructure
Check this box to display buildings, pipes, or other infrastructure with your profile.
Click this tab to define the infrastructure file and plot settings. (More info)
- Other 2D Files
Check this option to include existing RockWorks profiles as layers with your T-Data profile.
Click on this tab to select the existing profiles (.Rw2D files) to be included. (More info)
- Peripherals
Check this option to include various peripheral annotations with your profile. Options include titles, text blocks, legends, and more.
Click on this tab to activate the items and establish their settings. (More info)
- Border
Check this option to include a solid line border around the entire profile image.
Click on this tab to establish border settings.
- Output Options
- Save Output File: Check this to assign a name for the diagram in advance, rather than displaying it as Untitled.
- Automatic: Choose this option to have RockWorks assign the name automatically. It will use the name of the current program plus a numeric suffix, plus the ".Rw2D" file name extension.
- Manual: Choose this option to type in a name of your own for this file.
- Display Output: Check this option to have the resulting diagram displayed in RockPlot2D once it is created.
- Access the Borehole Manager program tab.
- Enter/import your data into the Borehole Manager, if you have not already done so. This tool specifically reads location, orientation (if any), and Time Interval data.
- Select the Borehole Operations | T-Data | Profile menu option.
- Enter the requested program settings, described above. Be sure to use the Profile Location tab at the top of the window to define the location of the profile slice within the model.
- Click on the Continue button to proceed.
If you've selected Use Existing Model, the program will load the information from the existing T-Data model (.RwMod file) and proceed to diagram generation.
If you've selected Create New Model, the program will scan the project database and extract the XYZ points for all of the downhole measurements for the selected T-Data track. (For T-Data, the elevations will represent interval midpoints.) It will apply any source data filters you have requested.
RockWorks will use the selected algorithm to create a solid model of the downhole time-based interval data. The completed model will be stored on disk under the indicated file name.
The program will then look at the coordinates specified for the profile cut and determine the closest nodes along the cut in the brand-new model, if created, or in the existing model. It will construct a vertical profile to illustrate the data values, using the selected color scheme. Logs and other diagram layers will be appended if requested. The completed diagram will be displayed in a RockPlot2D tab in the Options window if requested.
- You can adjust any of the program settings in the main Options tab and then click the Continue button again to regenerate the profile.
! If the T-Data model looks OK and you just need to adjust one of the diagram settings, you don't need to keep re-interpolating the model. Choose Use Existing Model and browse for the .RwMod file to be used for the profile.
- View / save / manipulate / print / export the profile in the RockPlot2D window.
- Use the Stretch button
 in RockPlot to fill the window with the profile. This is helpful if the profile is long and shallow.
- If the profile looks better with a vertical exaggeration greater than or less than 1, you can pre-define this in the Options tab which will generate better-looking axis annotations.
 Back to T-Data Menu Summary

RockWare home page