The Borehole Manager database offers individual data tables for entering the different types of downhole data. For example, the borehole location information is entered into the "Location" table. if your well is inclined or deviated, you can enter the downhole survey information in the "Orientation" table. If you have downhole stratigraphy data, you can enter these intervals into the "Stratigraphy" table.
When you add a new borehole to a project, the program will display a blank suite of data tables, each with a button tab that lists its name.
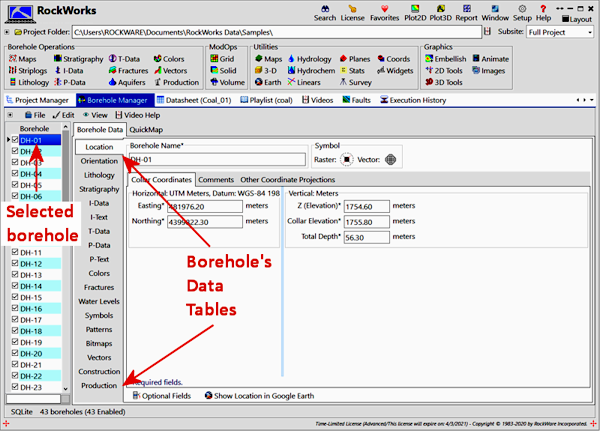
Simply click on a tab to bring that table to the front for entering your data; for example, click on the Stratigraphy tab to enter the downhole formation depths.
This section discusses the different data tables and how you enter the data. Click on an underlined item for more information.
! The Location table must be filled out for each borehole, but the others may be left blank.
- Location: (Required.)
- Collar Coordinates tab: This is where you enter the well ID, X and Y location coordinates (Eastings and Northings), surface elevation, collar elevation, and total depth (all required fields). You may also choose specific symbols for the well, which are used to represent the well location in RockWorks and Google Earth maps.
- Comments tab: Here you can enter well-specific notes.
- Other Coordinate Projections tab: This offers fields for entering (or computing) the well locations in other coordinate systems. For example, you may have your project data defined in UTM feet, but you can also enter the longitude/latitude coordinates or PLSS locations here.
- Optional tab: This is where you can display any customized fields you add to your Location table. You can add as many optional fields as you wish.
- Orientation: This table is where you enter your downhole survey information, in a depth, bearing, inclination format. If the well is vertical, this tab can be left blank.
- Lithology: Enter into this table observed downhole lithology materials. This table connects to a library of lithology "types" (and their colors/patterns) that you can define. (See Lithology v Stratigraphy for help on definitions.) Observed lithology data can be displayed in 2D and 3D logs. Lithology models can be interpolated and displayed as many types of diagrams: 3D voxels, profiles, cross-sections, fences, plan maps, and more.
- Stratigraphy: Into this data table you can enter interpreted downhole stratigraphic data. This table connects to a library of formation names (and colors/patterns) in the current project database. (See Lithology v Stratigraphy.) Stratigraphic intervals can be illustrated in strip logs, and can be used to build stratigraphic surface maps, isopach maps, projected stratigraphic sections, fence diagrams, stratigraphic block diagrams, and more.
- I-Data (Intervals): This table is used to store downhole numeric data that was sampled over one or more depth intervals, such as geochemical or geotechnical measurements. These data can be displayed as bargraphs along 2D and 3D strip logs, and can be interpolated into a solid model for display as vertical profiles, sections, and fence diagrams, plan maps, and voxel or isosurface displays.
- I-Text (Interval Text): This table is used to store downhole alpha-numeric data that was sampled over one or more depth intervals, such as sample numbers, colors, etc. This textual information can be displayed in 2D striplogs and log sections.
- T-Data (Time Intervals): This table is similar to I-Data, above, except that it includes a date (and time) field, allowing for entry of interval-based numeric data that change over time. These data can be filtered by date, and displayed as bargraphs along 2D and 3D striplogs, and can be interpolated into a solid model for display as vertical profiles, sections, and fence diagrams, plan maps, and voxel or isosurface displays.
- P-Data (Points): This table is where you enter downhole numeric data that was sampled at individual depth points, such as geophysical measurements. These data can be displayed as curves along 2D and 3D strip logs, and can be interpolated into a solid model for display as vertical profiles, sections, and fence diagrams, plan maps, and voxel or isosurface displays.
- P-Text (Point Text): This table is used to store downhole alpha-numeric data that was sampled individual depth points, such as sample numbers, comments, etc. This textual information can be displayed in 2D striplogs and log sections.
- Colors: Use this table to enter downhole rock/soil/core (etc.) colors that were sampled over depth intervals, for display in striplogs. Color data can also be interpolated into a solid color model for display in 3D as a voxel model or fence diagram, or in 2D as a profile, section, plan map, or surface map.
- Fractures: Use this table to enter sub-surface fractures that you wish to display on logs and log cross sections. Solid models of fracture locations can also be generated, for display as profile, section, and fence panels, plan maps, and voxel or isosurface displays.
- Water Levels: This table is used to enter dates and water levels for the borehole, for display in logs, profiles, plan-views, fences, and 3D models.
- Symbols: Use this table to select specific graphic symbols to be plotted at particular depths for this well, on a log or in a section.
- Patterns: Use this table to select specific graphic patterns to be plotted along a depth interval in a log or in a cross section.
- Bitmaps: In this table you can list any raster images to be displayed in your 2D and 3D logs and log sections. An interactive depth-registration tool is available.
- Vectors: This table is used to list downhole directional data, such as groundwater flow directions, for display in logs and log sections and interpolation as a solid model which can be used to represent void space (caverns).
- Well Construction: Use this table to define construction materials at particular depths and diameters, for display in 2D and 3D logs and log sections.
- Production: Use this table to enter oil and/or gas production for the well.
 Back to Entering Borehole Data - Overview

RockWare home page