The Contour Lines layer is offered in many RockWorks map windows. It is used to represent the distribution of z-values (elevations, concentrations) throughout the study site using line contours. Contour Lines are also available for display on solid model profile and section panels to represent G-value distribution.
Intervals
Labels
Omit Zero Contour
Omit Low Values
Omit High Values
Omit Segments Near Faults
Colors & Styles
 Contour Lines
Check this box to turn on the Contour Lines layer in your map or diagram.
Click on this tab to establish the contour options.
- Intervals: Choose from regularly-spaced, logarithmic, custom, or manually-defined contour intervals.
- Regular: Choose this for the program to draw contour lines at regularly-spaced intervals, which the program will determine automatically. For example, if the data ranges from 10 to 100, the program might choose a contour interval of 10 and the contours would be plotted at the following levels: 10 20 30, 40., 50, 60, 70, 80, 90, and 100.
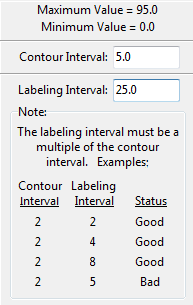
- Confirm Intervals: If checked, the program will let you confirm/override the suggested contouring and labeling intervals prior to creating the contour map. Note: The labeled contour interval must be a multiple of the unlabeled contour interval.
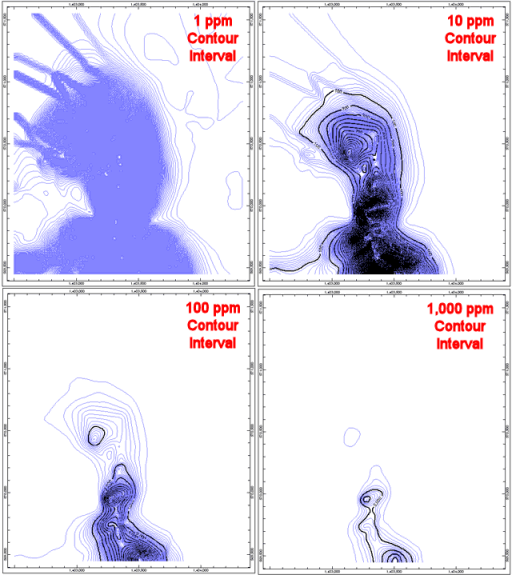
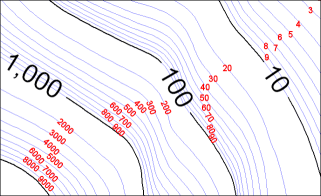
- Logarithmic (Base-10): Choose this option to draw the contour lines at logarithmically-spaced intervals. This option is useful for plotting data that not well suited for conventional, regularly-spaced contouring (e.g. geochemistry with a high range of z-values). The maps below depict a grid model that is grossly skewed by some very high values. Specifically, the bulk of the model is made up of values between zero and 200 while the anomalous regions exceed 10,000ppm. These maps depict this data set as a series of conventional, regularly-spaced contour maps. Notice how the 1ppm contour map shows the spatial variations within the lower levels while the 1000ppm map does not.
Compare the regularly-spaced contours in the diagrams above with the logarithmically-spaced contour maps below. Notice how the logarithmically-spaced contours (at 1, 10, 100, and 1000) show the lower-level variability without "saturating" the higher regions with contour lines.
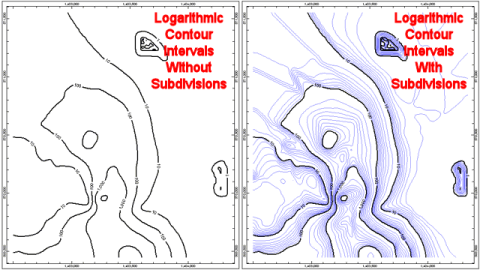
- Plot Subdivisions: Insert a check here if you wish to include the intermediate contour lines, as shown in the image to the right, above.
- Other notes:
- Logarithmic contour intervals are based on a base-10 convention.
- Logarithmic contour label intervals are automatically set to 10x increments (e.g. 0.001, 0.01, 0.1, 1.0, 10, 100, 1000, etc.)
- Decimal places within logarithmic contours are automatically computed.
- Logarithmic contouring should not be used with data that does not vary by an order of magnitude. For example, do not use it to plot structural contours. It's primarily intended for geochemical and geophysical data.
- The subdivisions (contours between the labeled intervals) are hardwired to base-10 (see diagram below in which labels have been manually added to unlabeled contours lines - aka "subdivisions").
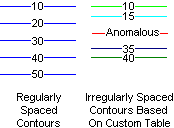
- Custom: Choose this option if you want the contour lines to be drawn at irregular spacings or with specific line styles, colors, and labeling characteristics.
- Contour Table: Click on the button to access the Contour Table to be used. The Contour Table is a customizable list of contour intervals, line styles, and labeling information that allows you to define exactly which contours are to be plotted. You can click on this item to view, edit, and rename this table as you wish. Note that you can include textual labels within a custom contouring table; imagine contours that read, "background" or "anomalous" or even "WOW!" See Contour Tables for more information.
- Manual: Choose this option if you want regular contour and labeling intervals but don't want to rely on the program's automatic selection with an override. (Manual contour intervals can be defined in RockWorks playlists and command scripts.)
- Minor Interval: Enter here the interval for unlabeled contours.
- Major Interval: Enter here the interval for labeled contours. This must be a multiple of the unlabeled contour interval.
- Labels: If checked, contour lines will include value labels. If you've selected Regular Contours (above) the intervals at which the contours are drawn and labeled are determined automatically by the program. These automatic intervals may be double-checked and overridden by the user (via the Confirm Intervals option, discussed above.). If you've selected Manual contours, the labeling interval will be determined by the value entered for the Major Interval.
- Color: Click to select the desired color for the contour labels.
- Size: Type in the contour label size, as a percent of map width. Smaller values will produce smaller labels.
- Spacing: Type in the spacing of the labels along the contour lines, again as a percent of the map width. Note that even a small spacing setting may not result in labels on contour lines with tight curves.
- Opaque Background: Insert a check here for contour labels to be plotted onto an opaque background.
-
- Manually Speficy Decimal Places: If unchecked, RockWorks will determine automatically the best number of decimal places for the contour labels.
If you prefer to define this manually, check this box and enter the number of decimals in the prompt. "0" corresponds to no decimal places, "2" to labels extending to the hundredths decimal place, and so on.
-
! A note about contour labels: As RockWorks tries to place a label in a contour line, it searches along the line for a spot with enough room to break the line and insert the label, at the font size and spacing you've declared. This means that contours with lots of bends may not easily accommodate labels. If your labeled contours aren't showing any/many labels, try reducing the font size and spacing.
! You can also edit the polylines individually when they are displayed in RockPlot2D. While this is certainly tedious for multiple lines, it can be handy to highlight specific contours. See Polyline Attributes for information.
- Omit Zero Contour: When plotting contours of certain data sets in which the z-data ranges between zero and a higher value (e.g. isopachs and stereonets), it is often desirable to not plot the zero-level contour interval. Otherwise, many spurious, boxy contours will be displayed.
- Omit Low Values: When plotting contours for grid models that have been filtered (such as polygon clipping) you can define the threshold below which contours should not be drawn; type that value into the Lower Threshold prompt. For example, if you have filtered a grid model so that the nodes outside a polygonal area are set to zero, you would enter the minimum non-zero value in the model in this prompt for the contours to end at the polygon boundaries.
! Note that if you filter grid models using the RockWorks Null value (-1e27) as the replacement, you do not need to turn on the Skip Low Values filter to ignore them - the program will ignore the null value automatically.
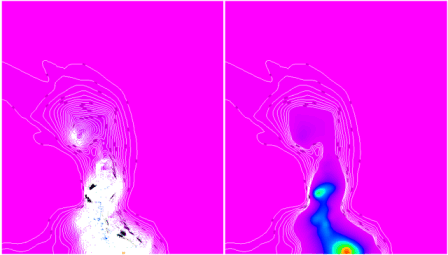
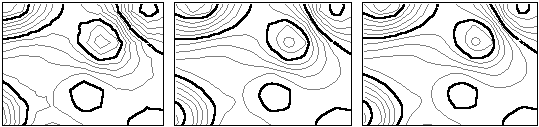
- Omit High Values: When plotting contours for grid models with anomalous highs, you can define the threshold above which contours should not be drawn; type this value into the Upper Threshold. The following diagram illustrates how a 50-unit contour obliterates the underlying solid-fill color anomaly. The diagram on the right shows the effect of the "Skip High Values" option.
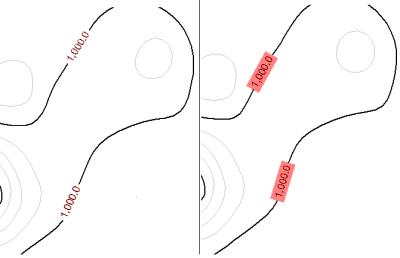
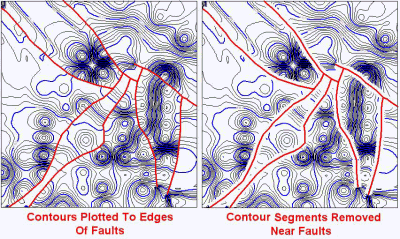
- Omit Segments near Faults: If you are contouring a faulted grid, you can insert a check in this box to prevent contours from being drawn right up to the edge of the fault polylines. Since this is a safer geological supposition, this setting is on by default.
- Colors & Styles: Use these settings to define how the labeled and unlabeled contours will look. Note that these settings will be ignored if you've selected Custom contours (above).
- Smoothing: Use the up- or down-arrows to define the number of times the contours should be smoothed. The program smoothes the contours by constructing triangles out of the contour line segments and computing new vertices. Contour lines may be smoothed in one or more passes, resulting in pleasing-looking lines. But, smoothed contours may not always honor the control points. Set the value to "0" for no smoothing. Set the smoothing factor to "1" to run the contours through the "smoother" once. Enter "2" to run the smoother twice, etc.
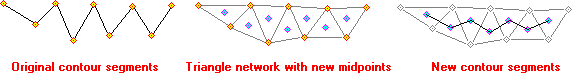
The example below shows the effect of 0, 1, and 2 smoothing passes on contours drawn on a very coarse grid.
Since benefits are negligible at higher numbers, when in doubt don't exceed a smoothing factor of "1". This will also minimize the differences between the contour lines and color-filled contours. If you are building grid-based maps, you might also find that increasing the grid density will create smoother contour lines.
- Unlabeled: Click on the displayed sample to choose a line style, thickness, and color for the contours that will be drawn without labels.
- Labeled: Click on the displayed sample to choose a line style, thickness, and color for the contours that will be drawn with labels.
Note: If you have requested contour interval confirmation (Confirm Intervals, above, is checked) the program will display a window like the following prior to contouring. The default intervals are determined automatically by the program, based on the range of Z values it encounters. You can change either or both, but be sure that the Labeling Interval is an even multiple of the Contour Interval.

RockWare home page