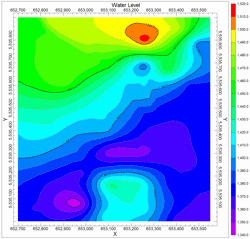
The Color Intervals layer is offered in many RockWorks map windows. It is used to represent the distribution of Z-values throughout the study site with solid color regions. You can conceptualize this as a line contour map with the blank spaces colored in, color-coded by Z-value. Colored Intervals are also available for display of G-value intervals in solid model profiles, section panels, contoured stereonet and ternary diagrams, and more.
 Color Intervals
Check this box to turn on the Color Intervals layer in your map or diagram.
Click on this tab to establish the contour options.
- Scheme: Choose from a variety of pre-set color schemes, or to create your own. (More info)
- Opacity: Use this to make the color contour layer semi-transparent when the map is displayed so that features below the contour map (e.g. airphotos) may be visible. You can enter any value between 100 (fully opaque) and 0 (fully transparent).
! Note that you can adjust the opacity of the contour layer interactively in RockPlot2D, but this setting permits you to establish it in advance for use in a Playlist.
- Intervals
- Interval Type
- Omit Lows: When plotting contours for grid models that have been filtered (such as polygon clipping) you can define the threshold below which contours should not be drawn; type that value into the Omit Values Less Than prompt. For example, if you have filtered a grid model so that the nodes outside a polygonal area are set to zero, you would enter the minimum non-zero value in the model in this prompt for the contours to end at the polygon boundaries.
! Note that if you filter grid models using the RockWorks Null value (-1e27) as the replacement, you do not need to turn on the Omit Lows filter to ignore them - the program will ignore the null value automatically.
- Omit Highs: When plotting contours for grid models with anomalous highs, you can define the threshold above which contours should not be drawn; type this value into the Omit Values Greater Than prompt.
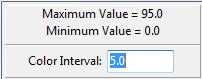
If you have requested color-contour interval confirmation (Confirm Intervals is checked), the program will display a window like the following prior to contouring. (The Color Interval prompt may be displayed below the line contour interval prompts if they've also been requested.) The default color interval will be determined automatically by the program based on the range of Z-Values it found. You can edit the color contour interval as you wish.
- You can adjust the transparency of your color-filled contours in RockPlot2D: Once your map is displayed, click the Edit arrow, right-click on the colorfill layer, and set the Opacity to a value less than 100. See Colorfill Attributes for more information.

RockWare home page