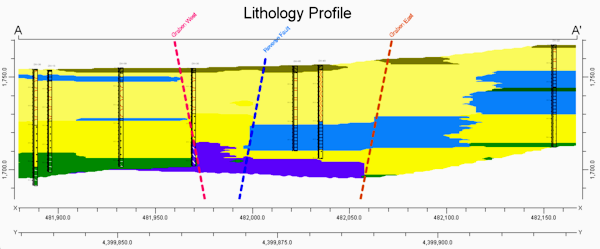
Use the Faults option to display fault lines in profile and section diagrams. This requires that you have one or more faults defined in a Faults program tab. Fault polylines will be drawn using the line style and color defined in the Faults tab, and will represent the intersection of the fault(s) with the profile or section panel.
 Faults
- Plot Fault Titles: Check this box to include the fault names in the polylines.
! Note: If you include fault titles in a multi-panel section diagram and if more than one of the panels intersect a fault, you will get multiple labels along that fault polyline.
- Position: Choose where the fault names are to be plotted; you can select multiple locations.
- Highest Endpoint: Choose this to plot the fault name at the top of the polyline. Select the text angle - horizontal, vertical, or angled.
- Lowest Endpoint: Choose this to plot the name at the bottom of the polyline. Select the text angle - horizontal, vertical, or angled.
- Along Fault Trace: Choose this to plot the fault name along the polyline.
- Font Size: Select the size for the fault name labels, as a percent of the project size.
- Opaque Background: Check this if the titles should have an opaque background; choose the fill color.
- Font Color = Fault Color: Check this if the labels should be plotted in the same color as the fault polyline.

RockWare home page