Use the Annotation tab, which is available in all profile, projected section, and cross section diagram menus, to access the settings which control how the diagram annotation will look. As you check items on/off, the cartoon at the top of the window should change to reflect your settings.
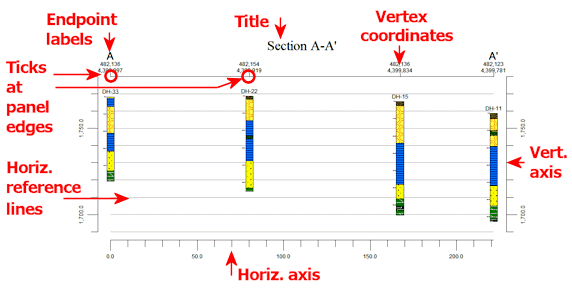
- Title
Check this box to include a title at the top of the profile or section diagram.
Click on this tab to specify:
- Title: Click in the prompt to type in the text to be displayed for the title. While you can manually edit the content of the title in RockPlot2D, it's usually easier to declare the title text here.
- Size: Type in the size for the font, as a percent of the size of your project.
- Endpoint Labels
Check this box to include in the diagram labels for the diagram endpoints, such as "A" and "A'" shown above. These would typically be associated with labels used on a reference map (the "Create Location Map" option). Y
Click on this tab to define:
- Left Label, Right Label: Click in these prompts to enter the text to be plotted for the left-edge label and the right-edge label.
- Size, specified as a percent of project size.
- Vertex Coordinates
Check this box to include the X, Y coordinates at the panel junctions (sections) or diagram edges (profiles).
Click on this tab to define:
- Size: Size for the labels declared as a percent of project size.
- Decimal Places: Type in the number of decimal places to appear in the labels.
- Tick Marks at Panel Edges
Check this box to include small tick-marks that extend upward at the panel junctions (sections) or at the diagram edges (profiles). They are typically used if you request the Plot Vertex Coordinates option.
Click on this tab to define:
- Size: The size of the ticks is declared as a percent of the project size. Default = 0.5.
- Horizontal Line Along Top
Check this box to include a solid, horizontal line at the top of the profile or section.
- Vertical Lines at Panel Edges
Insert a check here to include vertical lines at the panel junctions (sections) or at the diagram edges (profiles).
- Vertical Axes Annotation
Check this box to include vertical axes with elevation labels.
Click on this tab to access the settings:
- Right Axis Annotation Identical to Left Axis: Check this box if the left and right axes are to be identical. Uncheck this to be able to set up the left and right axes independently.
-
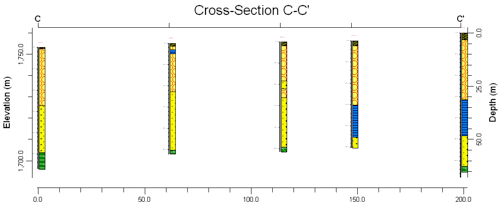
- Title: Enter here any label for the vertical axis (e.g. "Elevation" or "Depth").
- Labels Represent:
- Depth Below Datum: Choose this for the vertical axis labels to represent depths. Enter the elevation representing 0 depth.
- Elevations: Choose this for the vertical axis labels to represent elevations.
- Title Angle: Choose Vertical or Horizontal by clicking in the appropriate radio button.
- Label Angle: Choose Vertical or Horizontal by clicking in the appropriate radio button.
- Intervals: The increments at which the ticks and labels appear can be determined either automatically by the program or defined manually by you. (See also the Elevation Range options, below.)
- Automatic: The program will determine the intervals based on the vertical extent of the diagram.
- Manual: Enter the elevation or depth units at which the tick marks and the labels are to be plotted.
- Decimal Places: Determines the number of decimal places to be displayed in the elevation or depth labels.
- Automatic: Choose this option for the program to determine the number of decimal places automatically.
- Manual: Choose this option to specify how many decimal places you want in the labels.
- Size:
- Ticks: Enter the size for the tick marks on the vertical axes, as a percent of the project size.
- Labels: Enter the size for the labels, as a percent of the project size.
- Title: Enter the size for the labels, as a percent of the project size.
- Margin (%): Use this setting (which defaults to 0) to increase the offset of the vertical axes from the diagram.
- Horizontal Reference Lines
Check this box to plot horizontal lines across the middle of the diagram.
Click on this tab to access the settings:
- Vertical (Y) Intervals: The increments at which the lines appear can be determined either automatically by the program or defined manually by you. (See also the Elevation Range options, below.)
- Automatic: The program will determine the intervals based on the vertical extent of the diagram. They'll match the Automatic label intervals of the vertical axis, above.
- Manual: Enter the elevation units at which the horizontal lines are to be plotted.
- Horizontal Axis Annotation
Check this box to include the horizontal border axis in the plot.
Click on this tab to access the settings:
- Tick Marks: Enter the size for the tick marks on the distance (horizontal) axis, as a percent of the project size. Default = 1.0.
- Labels: In this prompt type in the size for the distance or coordinate labels, as a percent of the project size.
- Horizontal (X) Intervals: The increments at which the ticks and labels appear can be determined either automatically by the program or defined manually by you.
- Automatic: The program will determine the intervals based on the length of the diagram.
- Manual: Enter the distance (section) or coordinate (profile) units at which the tick marks and the labels are to be plotted.
- Decimal Places: Determines the number of decimal places to be displayed in the coordinate or distance labels.
- Automatic: Choose this option for the program to determine the number of decimal places automatically.
- Manual: Choose this option to specify how many decimal places you want in the labels.
- Label Angle: Choose Parallel to Axis forhorizontal labels, Perpendicular to Axis for vertical labels.
- Style (Profiles Only): For profile (projected) diagrams, you have a choice for what's displayed in the horizontal axis:
- Single Axis (X = Distance from Start): Choose this option if the horizontal axis labels should represent distance along the profile from left to right in the diagram. This is shown at the top of the following example.
-
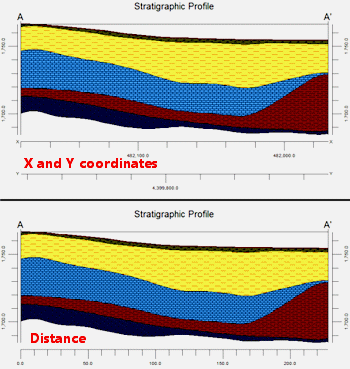
- Dual Axis (X and Y Coordinates): Choose this option to display the actual X and Y coordinates along the profile. (see above).
Note that for cross-section diagrams, the horizontal axis always represents distance.
- Labeling Intervals:
! If your profile is oriented north-south or east-west such that there is a small coordinate range along one axis and a large range along the other, use the Manual option to fine-tune the labels.
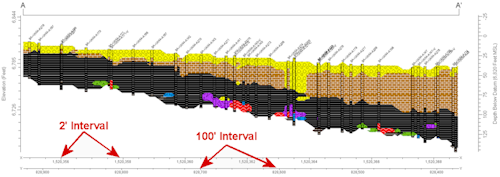
- X Coordinates
- Automatic: Choose this to have the program determine automatically the labeling interval.
- Manual: Choose this to define your own tick mark and interval for the X coordinate labels. Enter the distance (in your output units) at which you want tick marks and distance labels plotted.
- Y Coordinates
- Automatic: Choose this to have the program determine automatically the labeling interval.
- Manual: Choose this to define your own tick mark and interval for the Y coordinate labels. Enter the distance (in your output units) at which you want tick marks and distance labels plotted.
- Dimensions:
- Tick Marks: Enter the size for the axis tick marks as a percent of the project size.
- Font Size: Enter the size for the axis labels as a percent of project size.
- Caption: Enter here any label for the horizontal axis (e.g. "Distance"). You can define the size for the caption text, as a percent of the project size.
- Elevation Range
Use these settings to select how the range of the vertical axis will be defined.
- Output Dimensions: Choose this option to set the perimeter annotation to equal the Z (Elevation) axis range as defined in the Output Dimensions. See the example on the left in the following diagram. (Default.)
-
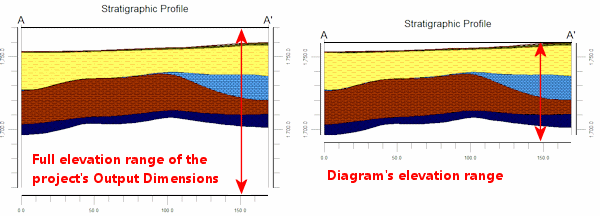
- Automatic: Choose this option to have the program set the perimeter annotation based on the elevation range of the diagram itself. This can be very useful if you've elected to hang a stratigraphic section on a particular formation (resetting all elevations relative to it) or if your diagram represents a subset of the larger project range. See the example on the right in the previous diagram.
- Manual: Choose this option to enter specific top and base elevation values for the diagram. This is handy if you don't want to default to the project dimensions but also want all of your diagrams to be labeled using the same elevation range.
- Minimum Elevation: Enter the elevation to be represented at the base of the vertical axes.
- Maximum Elevation: Enter the elevation to be represented at the top of the vertical axes.

RockWare home page