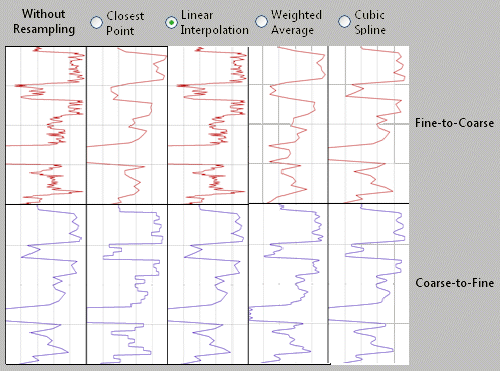
- Closest Point: (P-Data) The resampler will proceed downhole at the interval specified below, and will simply grab the closest point for processing.
- Linear Interpolation: (P-Data) The resampler will add additional points with very little to no change in curve appearance when sampling from coarse to fine
- Enclosing Interval: (I-Data, T-Data) The resampler will proceed downhole at the interval specified below, and will use the value listed for the depth interval within which the resampled interval lies. See Log Examples, below, for samples of how the resampling will affect I-Data logs.
- Weighted Average: The resampler will take a weighted average of nearby values.
- Cubic Spline: (P-Data) This option minimizes the curvature when resampling points, rendering a smoother curve.
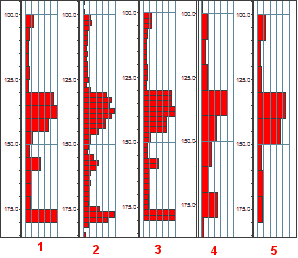
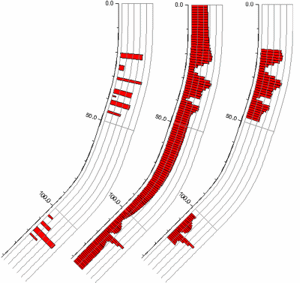
In the I-Data example below:
#1 shows the original data.
#2 shows a 2-foot resampling, weighted average.
#3: 2-foot resampling, enclosing interval.
#4: 10-foot resampling, weighted average.
#5: 10-foot resampling, enclosing interval.
P-Data examples are shown below:
This can be very helpful for the modeling of datasets in which only the high values have been sampled (and/or saved). In the following example, you can see the progression from the original data, resampled data with no distance filtering, resampled data with distance filtering, and resampled data with distance filtering and dummy values.
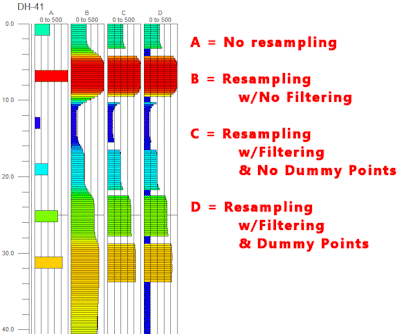
For example, consider a uranium exploration project in which the downhole data is limited to grade/thickness values only for intervals that exceed an economic cutoff value. As a consequence, all of the input data is high or anomalous resulting in a model that it ridiculous because there are no low data values to constrain model. This new feature attempts to solve this problem by adding dummy low values (typically zero) to the intervals that are otherwise undefined thereby limiting the extents of the high-grade ore to the areas adjacent to high control-point values. If you activate this filter, you can enter the dummy value to be used.
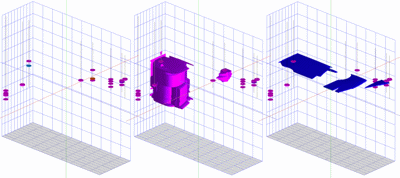
The following examples depict a data set that consists of 30 control points (small discs within borehole diagrams on left). These control points represent only the higher values (i.e. no zero-value points). The diagram in the center depicts a model based only on the original control points using the Anisotropic modeling algorithm. The diagram on the right depicts a model that was based on the original points plus 3,818 new zero-level dummy points there were added by the program. Notice how the model is constrained by the added points.
Log Examples: Below are some examples of how Resampling (above) will affect the appearance of 3D I-data logs:
- Tubes: Without resampling the bargraph tube edges will correspond with the top and bottom of the I-Data interval (i.e. the tube radius is set to half of the interval thickness and the tube midpoint is at the interval midpoint). With Resampling turned on, the bargraph tubes will plot at the user specified thickness (i.e. radius x 2 ), centered on the midpoint of the depth interval.
- Cylinders: Without resampling, the cylinder top will correspond with the top of the interval and the base will correspond to the base of the interval). With Resampling, the program will plot the cylinders such that the cylinder height is set to the user-specified interval, centered on the midpoint of the depth interval.
- Oblates: Without Resampling, the oblate top will correspond with the top of the interval and the base will correspond with the base of the interval. With Resampling, the program will plot the oblates such that the oblate height is set to the user-specified interval, centered on the midpoint of the depth interval.
- Spheres: The Interval Thickness settings have no effect upon spheres because their radius is based on the I-Data value alone.