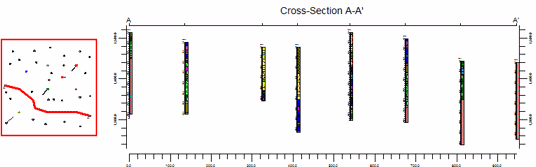
In RockWorks, the 2D profile and cross section diagrams and the 3D fence diagrams offer an option to create a Location Map that shows the section or panel locations in a plan-view map. This topic discusses the settings available in the Location Map option.
 Location Map
Check this item to include a location map with your cross-section, profile, or fence diagram.
Click on this tab to set up the map appearance.
- Map Location
- Display Map as Separate Diagram: Check this to display the location map in a separate RockPlot2D tab, as an independent graphic. (For sections and profiles, you can both append the map to the section/profile diagram and create the map image separately.)
- Append Map to Diagram: Insert a check here to include the location map in the profile or section diagram itself.
! Note: Embedding section-location index maps within diagrams that will be stretched vertically is not advisable. If you wish to combine a section location map with a vertically exaggerated cross-section, generate the cross-section and the index-map separately and combine them with the ReportWorks program.
- Position (Relative to Diagram): Click in the appropriate button to define whether the map is to be placed above, below, or to the left or right of the profile or section diagram.
- Size (Relative to Diagram): Click the appropriate button to define the size of the location map, relative to the section or profile.
-
- Margins: Type in the margin or gap, as a percent of your project size, between the diagram and the map laterally or vertically.
- Line Type: Click this tab to define the line style, thickness and color for the map line which will illustrate the slice location.
- Profile Swath
Check this option to display the "swath" (cutoff distance between the profile axis and control points) within the location map.
Click on this tab to set up the swath options.
This option ONLY APPLIES to Striplog | 2D Striplog Profile diagrams, and other Profile diagrams in which you have activated the Plot Logs setting. (See Excluding Logs from a Profile for more information.)
- Default Search Distance: Click here to type in the default distance to either side of the profile line within which logs will be projected onto the section line. If you change this distance interactively in the Profile Location window, the swath distance in the map will be adjusted accordingly.
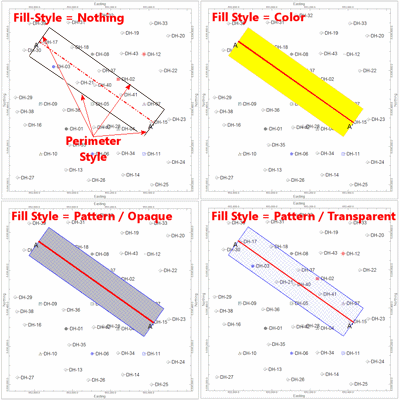
- Color: Click this button to fill the swath area with a solid color. Click the color box to select the fill color.
- Pattern: Click this button to fill the swath area with a pattern design.
- Pattern Type: Click here to choose the fill pattern design and the foreground and background colors.
- Background: Choose Opaque or Transparent.
- No Fill: Click this button for there to be no fill in the swath area.
- Perimeter Style: Click the line box to choose the line style/color/thickness for the swath perimeter line.
- Plot Endpoint Labels
Check this item to include endpoint labels in the location map. If you have activated the Endpoint Labels in the Perimeter Annotation, you can request that these same labels be displayed on the location map.
Click on this tab to enter the label settings.
- Font Size: Click to establish the size of the endpoint label text, as a percent of the map dimensions.
- Offset: This setting determines the distance from the line endpoints on the map that the labels will be placed. Default is "2" (as a percent of the map dimensions).
- Borehole Locations
Check this box to include a variety of borehole map options.
Click on this tab to set up the map. (More info)
- Labeled Axes
Check this item to include coordinate labels, titles, etc. in the map border.
Click this tab to establish the border options. (More info)

RockWare home page