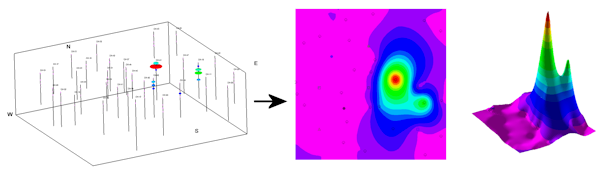
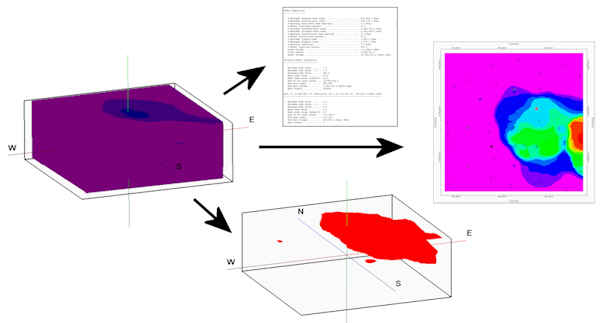
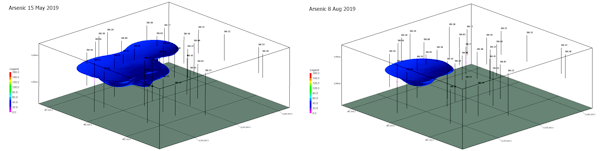
3D Solid: A 3D isosurface or voxel display of the interpolated block model. (More info)
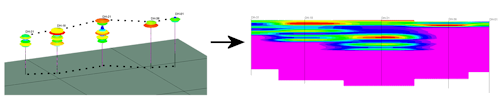
Multiple Solids: Create solid and grid models representing a selected T-Data item at sequential time intervals. (More info)

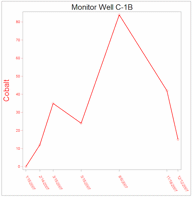
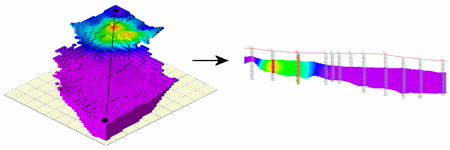
2D Profile: Create a profile diagram sliced between two points in the T-Data solid model, with projected striplogs, and color/contour fills. (More info)
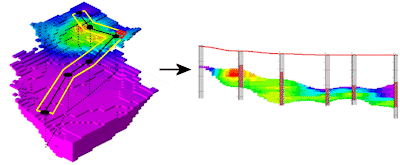
Section - Model-Based: Create a 2D multi-panel cross section, sliced between multiple points in the T-Data solid model, with vertical striplogs at panel edges, and color/contour fills. (More info)

Section - Hole-to-Hole: Create a 2D multi-panel cross section with quick correlation panels for a selected track of T-Data between boreholes. Include vertical striplogs at panel edges, and color/contour fills. (More info)
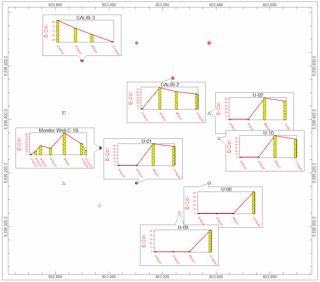
Projected Section - Model-Based: Create a 2D multi-panel cross section, sliced between multiple points in the T-Data solid model, with striplogs projected onto panels, and color/contour fills. (More info)
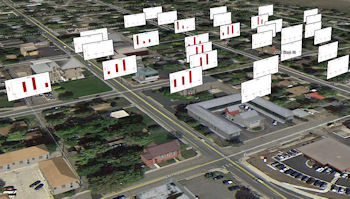
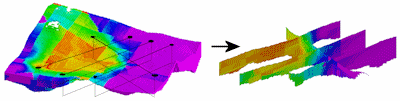
Fence: Create a 3D multi-panel fence diagram, sliced between multiple points in the T-Data solid model, with 3D logs and color fills. (More info)
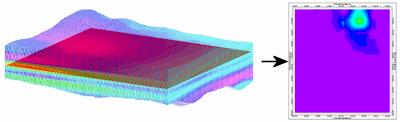
Surface Map: Create a map representing the interpolated values where the T-Data solid model intersects a designated surface (.RwGrd file). (More info)
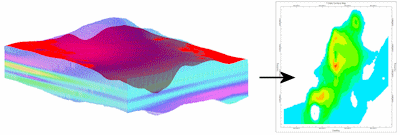
Plan Map: Create a map representing the interpolated values where the T-Data solid model intersects a horizontal plane. (More info)