Use this program to:
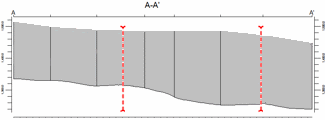
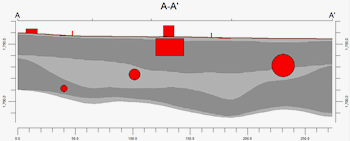
The section panels can be color-coded in a variety of ways, logs can be plotted at the panel junctions, and additional layers can be appended. The completed I-data section can be displayed in RockPlot2D.
See also
I-Data Profiles for single-panel cross sections with projected logs
I-Data Projected Sections for multi-panel sections with projected logs
Hole to hole I-Data Sections for quick sections not based on a solid model
Feature Level: RockWorks Standard and higher
Menu Options
Step-by-Step Summary
Tips
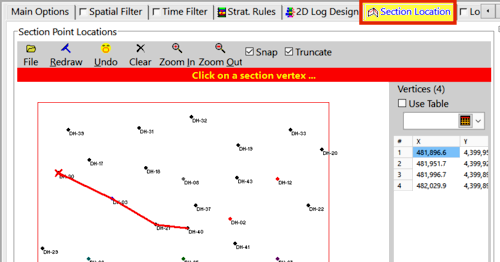
DH-30
DH-03
DH-21
DH-40
481896.8 4399952.0
481953.3 4399923.8
481997.6 4399898.1
482031.0 4399892.9
If you've selected Use Existing Model, the program will load the information from the existing model (.RwMod file), and will proceed to diagram generation.
If you've selected Create New Model, the program will scan the project database and extract the XYZ points for all of the downhole measurements for the selected I-Data track. (For I-Data, the elevations will represent interval midpoints.) It will apply any source data filters you have requested.
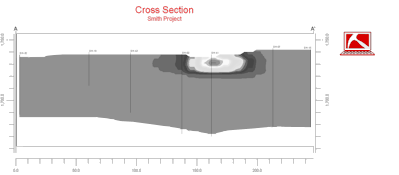
The program will use the selected algorithm to create a solid model of the downhole interval data representing geochemistry, geotechnical measurements, etc. The completed model will be stored on disk under the indicated file name.
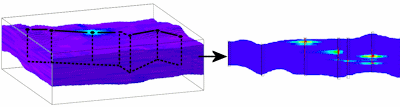
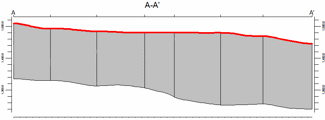
The program will then look at the coordinates specified for the section panels and will construct a vertical profile of each to illustrate the data values, using the selected color scheme. The panels will then be appended together to create the multi-panel section. Logs and other diagram layers will be appended if requested. The completed diagram will be displayed in a RockPlot2D tab in the Options window, if requested.
! * If the I-Data model looks OK and you just need to adjust one of the diagram settings, you don't need to keep re-interpolating the model. Choose Use Existing Model and browse for the .RwMod file to be used for the section.
![]() Back to I-Data Menu Summary
Back to I-Data Menu Summary
![]()