RockWorks | Borehole Operations | I-Data Menu
RockWorks offers a selection of tools for the display and analysis of interval-sampled downhole data (I-Data).
- T-Data menu summary for interpolating interval data with dates.
- Striplogs for displaying observed data only.
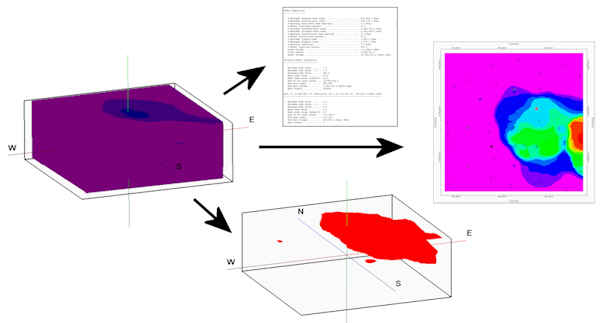
Model-Based Diagrams: Interpolate a solid model for a selected I-Data track, or read an existing I-Data solid model, for display as:
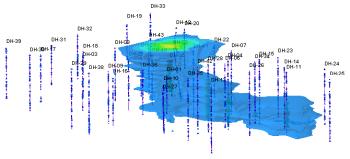
3D Solid: A 3D isosurface or voxel display of the interpolated block model. (More info)
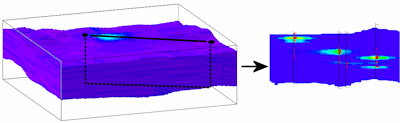
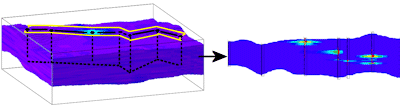
2D Profile: Create a profile diagram sliced between two points in the I-Data solid model, with projected striplogs, and color/contour fills. (More info)
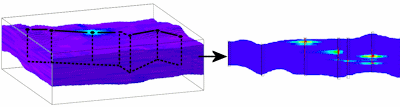
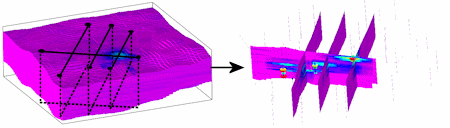
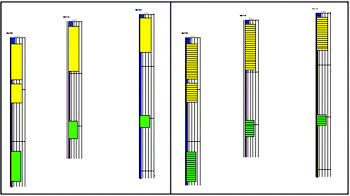
Section - Model-Based: Create a 2D multi-panel cross section, sliced between multiple points in the I-Data solid model, with vertical striplogs at panel edges, and color/contour fills. (More info)
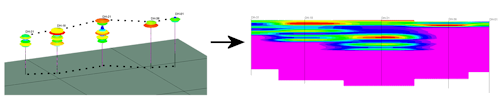
Section - Hole-to-Hole: Create a 2D multi-panel cross section with quick correlation panels for a selected track of I-Data between boreholes. Include vertical striplogs at panel edges, and color/contour fills. (More info)
Projected Section - Model-Based: Create a 2D multi-panel cross section, sliced between multiple points in the I-Data solid model, with striplogs projected onto panels, and color/contour fills. (More info)
Fence: Create a 3D multi-panel fence diagram, sliced between multiple points in the I-Data solid model, with 3D logs and color fills. (More info)
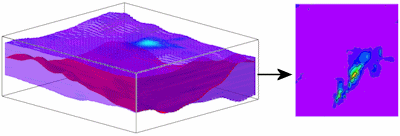
Surface Map: Create a map representing the interpolated values where the I-Data solid model intersects a designated surface (.RwGrd file). (More info)
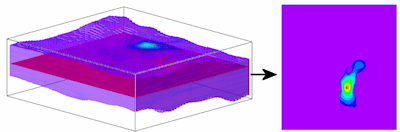
Plan Map: Create a map representing the interpolated values where the I-Data solid model intersects a horizontal plane. (More info)
Statistical Tools/Graphs/Maps
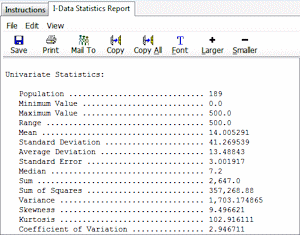
Statistics: Scan a selected track of I-Data from the database, and compute general statistics. (More info)
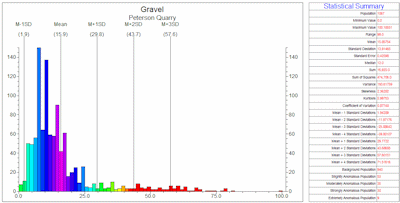
Histogram: Scan a selected track of I-Data from the database, and generate a frequency histogram. (More info)
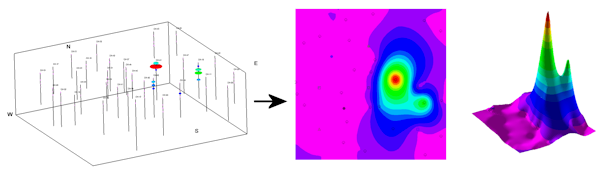
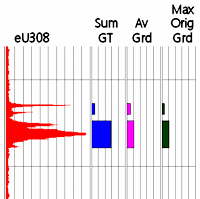
Statistics Map: Scan a selected track of I-Data from the database, and generate a grid model and High/Low/Average/Sum map, in 2D and/or 3D. (More info)
Data and Analysis Tools
Volumetrics: Read an existing I-Data solid model and apply a variety of filters, for a detailed volume report and diagram. (More info)
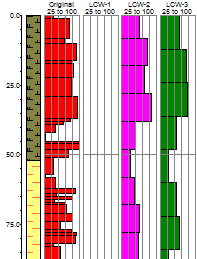
Compute Length-Weighted Averages: Scan a selected track of grade values and compute length-weighted averages for a stratigraphic unit, elevation increments, depth increments, or the entire borehole. (More info)
Compute Grade * Thickness Statistics: Scan a selected track of grade values and compute a variety of GT (grade x thickness) statisticals with user-defined minimum grade and maximum waste-thickness cutoffs. (More info)
Resample: Resample non-gradational I-Data values (e.g. classification data), storing the output in a new column in the database. (More info)
 Back to Borehole Operations Summary

RockWare home page