RockWorks | Utilities | Map Menu
Use the tools in the Utilities | Map menu to read spatial data from the Datasheet Editor, and generate a variety of different maps. This topic summarizes the tools that are available - click on a link or picture for more information.
Table of Contents
 Back to Utilities Summary
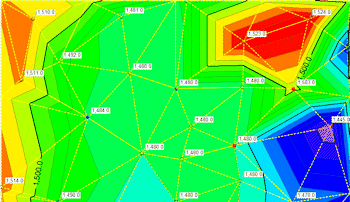
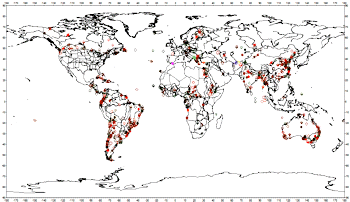
EZ Map: Read XYZ data from the datasheet, create an "EZ map" with symbols, labels, Delaunay-triangulated line/color contours, triangle network, background image, and/or border annotation. (More.)
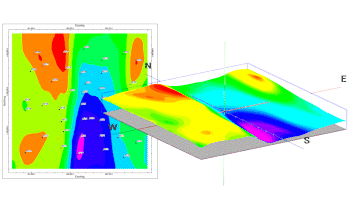
Grid-Based Maps: Read XYZ data from the datasheet, interpolate a grid model (or read an existing grid model), and create a map with symbols, labels, grid-based line/color contours, triangle network, background image, and/or border annotation. (More.)
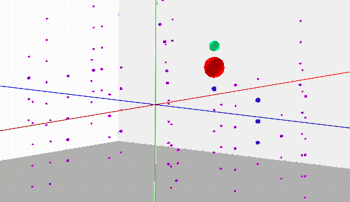
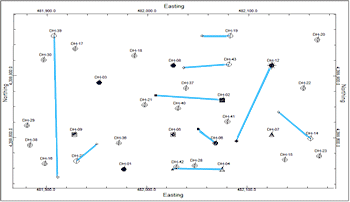
3D Point Maps: Read XYZ data from the datasheet, display the points in 3D with a variety of size/color options. (More.)
Contour Animator: Read XYZ data from the datasheet, display the points in 3D with a variety of size/color options. (More.)
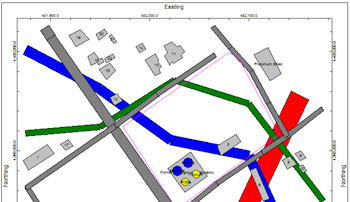
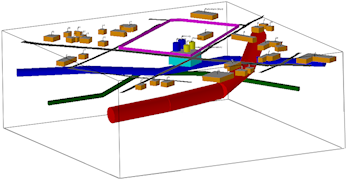
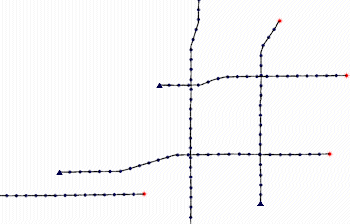
Infrastructure Maps:
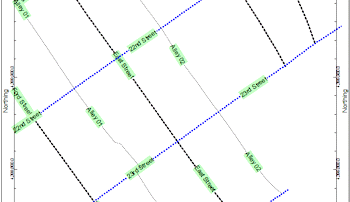
- 2-Dimensional Map: Read infrastructure objects and parameter settings from a text file and display them as a 2D map.
- 3-Dimensional Diagram: Read infrastructure objects and parameter settings from a text file and display them in 3D.
Point + Line Maps: Read XY point pairs from the datasheet, display symbols and/or labels at these locations, and draw a line connecting them. (More.)
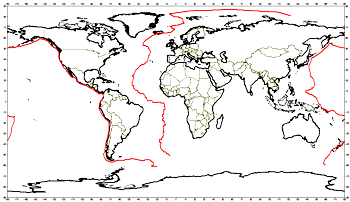
Polyline Maps:
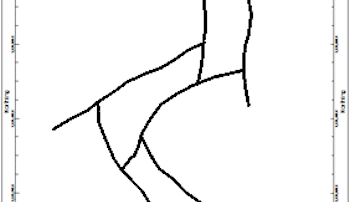
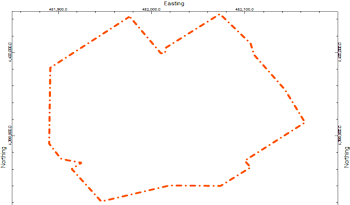
- Single Polyline - Simple: Read XY point coordinates from the datasheet, display a polyline between the vertices in a 2D map.
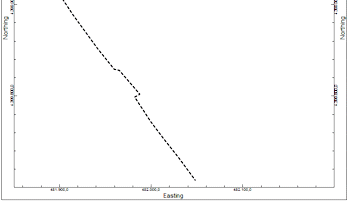
- Single Polyline - Advanced: Read XY point coordinates from the datasheet, display the polyline in a 2D map, with a variety of line, color, labeling, and symbol options.
- Multiple Polylines - Simple: Read a listing of separate polyline files, each containing XY point coordinates, and display the polylines in a 2D map using a uniform line style and color.
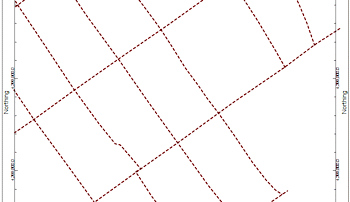
- Multiple Polylines - Advanced: Read a listing of separate polyline files, each containing XY point coordinates, and display the polylines in a 2D map, with a variety of line and color options.
- Faults (From Borehole Database): Read a listing of fault polylines from a Faults table in the database, and display the polylines in a 2D map using a uniform line style and color.
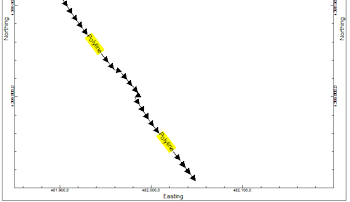
- Shotpoint: Create maps which illustrate shotpoint locations as read from the datasheet.
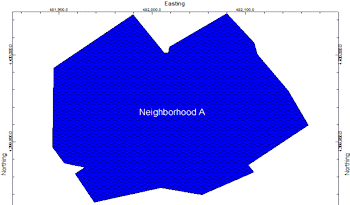
Polygon Maps:
- Single Polygon - Simple: Read XY point coordinates from the datasheet, construct a polygon between the vertices in a 2D map.
- Single Polygon - Advanced: Read XY point coordinates from the datasheet, display the polygon in a 2D map, with a variety of line and color options.
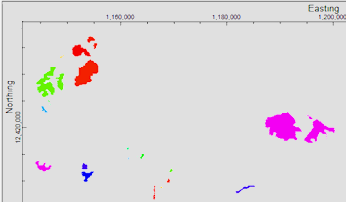
- Multiple Polygons - Simple: Read a listing of separate polygon files, each containing XY point coordinates, and display the polygons in a 2D map using a uniform line style and color.
- Multiple Polygons - Advanced: Read a listing of separate polygon files, each containing XY point coordinates, and display the polygons in a 2D map, with a variety of fill, labeling, and color options.
- Multiple Polygons to Grid: Read a listing of separate polygon files, each containing XY point coordinates, and create a new grid model with node values initialized to a specified Z value inside each polygon. Display as a 2D map or 3D surface.
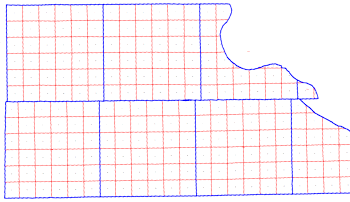
Claim, Lease and Section Maps:
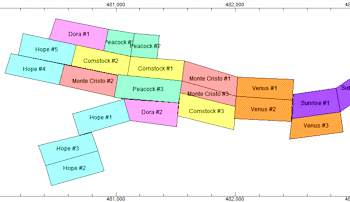
- Claim Map: Create a map displaying 4-cornered claim blocks.
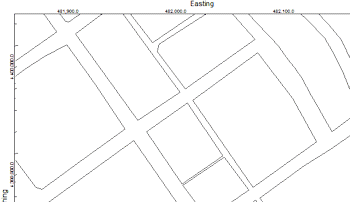
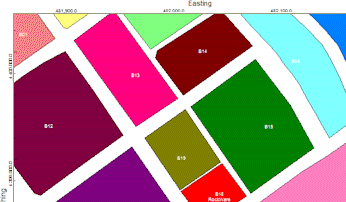
- Lease Map: Read lease descriptions in a Range-Township-Section-quarter/quarter or lot format, and create a map illustrating lease block boundaries, filled with patterns and/or colors, based on the RockWare LandBase.
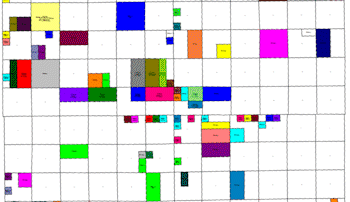
- Section Map: Create a map of Range, Township, and Section boundaries, based on the RockWare LandBase.
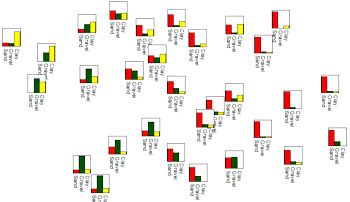
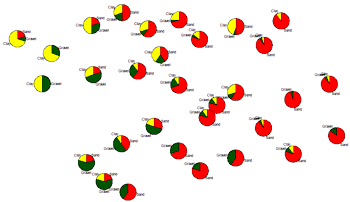
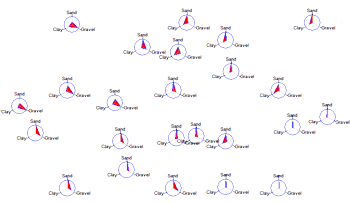
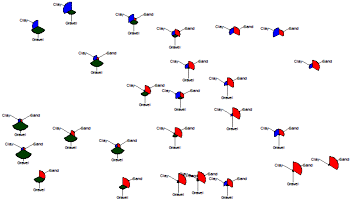
Multi-Variate Maps: Create maps which illustrate multiple measurements at map points.
- Barchart Maps: Illustrate the relative percentage multiple variables as varying-length bars at each sample location.
- Piechart Maps: Illustrate the relative percentage of multiple variables as varying-width pie "slices" at each sample location
- Spider Maps: Illustrate the relative percentage of multiple variables as polygons within a circle.
- Starburst Maps: Illustrate the relative percentage of multiple variables as varying-length pie "slices" at each sample location.
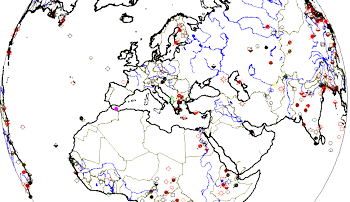
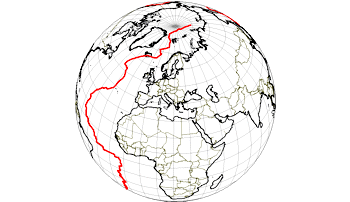
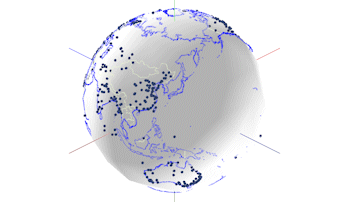
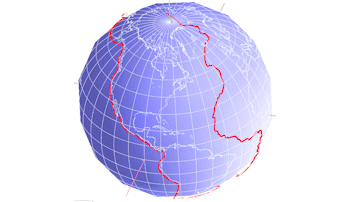
Globe Maps: Display your point or polyline data on various Earth projections.
Back to Utilities Summary

RockWare home page
