RockWorks | Utilities | Map | Bar Chart Map
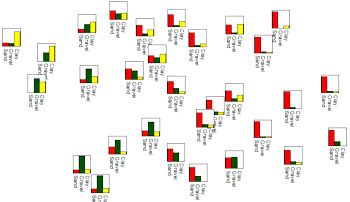
This program reads location data and values for up to 9 selected variables from the Utilities datasheet, and generates a map with mini-bargraphs at each sample location. The resulting map is displayed in RockPlot2D.
Menu Options
Step-by-Step Summary
Menu Options
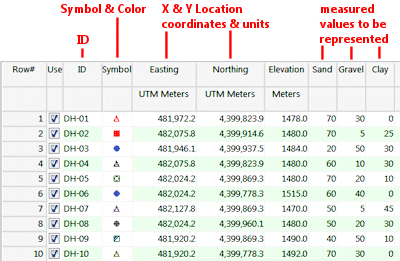
- Input Columns: The prompts along the left side of the window tell RockWorks which columns in the input datasheet contain what data.
Click on an existing name to select a different name from the drop-down list. See a sample data layout below.
- Easting (X): Column that contains the X coordinates for the sample locations.
These can be Eastings in meters or feet, decimal longitudes, etc. See Defining your Datasheet Coordinates for more information.
- Northing (Y): Column that contains the Y coordinates for the points.
- The columns containing the values to be represented in the bargraphs are defined below.
- Plot Component # 1 - Plot Component # 9: You can request up to 9 components be represented in the small bar charts by inserting a check in the appropriate check-box. For each component that you activate, expand the heading to choose the data source and color.
- Column: Click to the right to select the name of the column containing the data listing for that component.
- Color: Choose the color for that component's bar.
- Diagram Size: Click on this button to select a width and height for each mini-bar chart, expressed as a percent of the map width. Examples:

- Plot Labels: Insert a check here if each bar in the bar charts is to be labeled with its component's name.
- Label Size:
- Choose Automatic for RockWorks to determine the optimal size for the text.
- Choose Manual to define a specific label size, as a percent of the map width.
- Size: Click to the right to enter the label size as a percent of the map width.
- Label Angle: Click to the right to enter the angle. In the examples above, the text is plotted at "180", or reading to the south. (Recommended.) Enter "0" for vertical labels reading to the north.
- Plot Diagram Borders: Check this box to include thin-line borders around each bargraph.
- Background Color: Click to the right to choose a background fill color for the graphs. In the examples above, the color was set to white.
Step-by-Step Summary
- Access the RockWorks Utilities program tab.
- Create a new datasheet and enter or import your data into the datasheet.
Or, open one of the sample files and replace that data with your own. (In this example, the sample file = "RockWorks17 Data\ Samples\Soil_Properties_01.rwDat".) See Multi-Variate data format for details.
Longitude and latitude coordinates must be in decimal format. If you're using another coordinate system, be sure you've specified the Units and the Projection Settings as appropriate.
- Select the Map | Bar Chart Map menu option.
- Enter the requested menu items, discussed above.
- Click the Process button at the bottom of the menu to proceed.
The program will read the selected components from the indicated columns of the datasheet. It will normalize the values and generate small bargraphs at each map location using the requested color and size. The completed map will be displayed in a RockPlot2D tab in the options window.
- You can adjust any of the settings in the Options window (scalar, colors, etc.) and then click the Process button again to regenerate the map.
! Each time you click the Process button, the existing display will be replaced.
- View / save / manipulate / export / print the map in the RockPlot2D window.
 Back to Map Menu Summary

RockWare home page