RockWorks | Utilities | Map | Claim Map
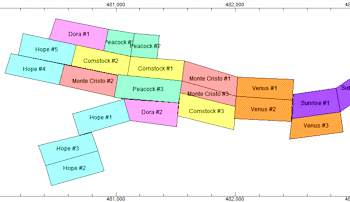
Use this program to read a listing of data from the Datasheet Editor - claim names and 4 pairs of XY corner points - and create a map illustrating the claim blocks, filled with patterns and/or colors, for output to RockPlot2D. The map coordinates will reflect the current Output Coordinates of your project.
See also: Google Earth Claim Maps - Simple and Advanced
Menu Options
Step-by-Step Summary
Menu Options
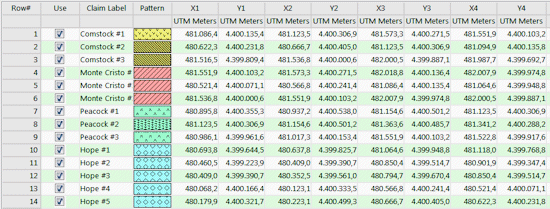
- Input Columns: The prompts along the left side of the window tell RockWorks which columns in the input datasheet contain what data.
Click on an existing name to select a different name from the drop-down list. See a sample data layout below.
- Title: Column that contains the name for the claim, which will be plotted as a label in the output map.
- Pattern: Column that contains the pattern and colors to be used to fill the claim block on the output map.
- X1, Y1: Columns that contain the X and Y coordinates for one of the claim corners.
These can be Eastings and Northings in meters or feet, decimal longitudes, etc. See Defining your Datasheet Coordinates for more information.
- X2, Y2: Columns that contain the X and Y coordinates for next polygon corner.
- X3, Y3: Columns that contain the X and Y coordinates for next polygon corner.
- X4, Y4: Columns that contain the X and Y coordinates for last polygon corner.
- Titles: Check this box if the claim titles are to be included as labels in the map.
- Text Size: Click to the right to type in a size for the labels, as a percent of your project area.
- Color: Click the color box to choose a color for the map text.
- Fill Polygons: Check this box to fill the claim blocks with patterns or colors. Expand this heading to select the fill type. If you don't have patterns defined in your datasheet, leave this unchecked.
- Patterns: Click in this button to fill the claim rectangles with the patterns and colors listed in the datasheet (whose column name you defined above).
- Colors Only: Click in this button to fill the claim rectangles with the background colors for the patterns which are shown in the datasheet.
- Perimeter Line Style: Click to the right to choose the claim block perimeter line style and color.
- Border: Check this to include a border around the claim map which shows the coordinate range of the axes. Expand this heading to establish the border options.
Step-by-Step Summary
- Access the RockWorks Utilities program tab.
- Create a new datasheet and enter or import your claim data into the datasheet.
Or, open one of the sample files and replace that data with your own. (In this example, the sample file = "RockWorks17 Data\ Samples\Claim_Map_01.rwDat".) See Claim Data format for details.
Longitude and latitude coordinates must be in decimal format. If you're using another coordinate system, be sure you've specified the Units and the Projection Settings as appropriate.
- Select the Utilities | Map | Claim Map menu option.
- Enter the menu settings as described above.
- Click the Process button to continue.
The program will read the corner coordinates from the current data sheet and create a map illustrating the claim rectangles, with specified fill and labeling settings. The completed map will be displayed in a RockPlot2D tab in the Options window.
- You can adjust any of the settings in the Options window and then click the Process button again to regenerate the map.
! Each time you click the Process button, the existing display will be replaced.
- View / save / manipulate / export / print the map in the RockPlot2D window.
 Back to Map Menu Summary

RockWare home page