RockWorks | Utilities | Maps | EZ Maps
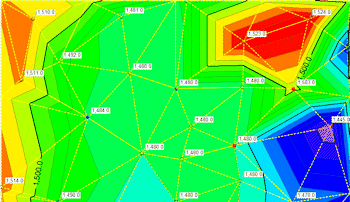
This program is used to build 2-dimensional (flat) maps for X, Y, and Z coordinate data listed in the Utilities datasheet. The maps can include any of the following layers: map location symbols, map symbol labels, line contours, color-filled contours, border annotation, background bitmap image, and the triangulation network that was used to build the line or color contours.
! 3D surface maps are not available with this tool. Use, instead, the Grid-based Map option.
Menu Options
Step-by-Step Summary
Menu Options
- Set up the Input Columns (along the left edge of the window).
- X (Easting): Select the column in the main datasheet that contains the X or Easting coordinates.
These can be Eastings in meters or feet, decimal longitudes, etc. See Defining your Datasheet Coordinates for more information.
- Y (Northing): Select the column that contains the Y or Northing coordinates.
- Z (Elevation): If you wish to create contours or color-filled intervals, select here the name of the column in the main datasheet that contains the numeric "Z" values (elevation, concentration, etc.) to be contoured. You do not need to define a Z-Column if you are creating a point map only.
- Map Layers: In the middle pane of the window, select the layers you wish to incorporate into the map, inserting a check-mark in those you wish to include. Establish the settings for each activated layer, such as colors, data source, etc. See 2D Map Layers for more information.
- Symbols: Check this option to include uniform or unique symbols in your map. Expand this heading to access the symbol options.
- Labels: Check this option to include one or more labels for each symbol. Expand this heading to access the label options.
- Contour lines: Check this to include line contours to represent the data in the selected Z column, above. Expand this heading to access the contour options.
! Line and color contours will be drawn using the Delaunay Contouring method.
- Colored Intervals: Check this to include color-filled contours to represent the data in the selected Z column. Expand this heading to access the color-contour options.
- Decluster Points: Insert a check here to have the program remove duplicate points prior to contouring.
- Network: Check this box to include the network of triangles that the program will construct to build the map contours.
- Background Image: Check this to include a raster image as a background layer in the map. Expand this heading to define the raster options: image name and location settings.
- Border: Check this to include a border around the EZ map which shows the coordinate range of the axes. Expand this heading to establish the border options.
- Interpolate Edge Points: If activated, this setting will force the program to insert points along the edge of the study area so that the contours can be drawn to the edge. It does this by inserting 5 points at equal spacing along the map boundaries (with one in each corner) and assigning them a value using the Inverse-Distance squared method. These new points can then be used when drawing the triangle network, assuring that all edges and corners are included within the network. See Delaunay Contouring for more information.

Step-by-Step Summary
- Access the RockWorks Utilities program tab.
- Create a new datasheet and enter or import the location coordinates for the sites to be displayed in the map, and the optional listing of a z-value column to be contoured. (More.)
Or, open one of the sample files and replace that data with your own.
- Select the Map | EZ Map menu option.
- Establish the menu settings as described above.
- Click the Process button to create the map.
- If you have activated the Confirm Intervals setting for either Contour Lines or Color Intervals, the program will display a summary window with default contour intervals. Adjust these items if necessary and click OK.
The program will create the map with the selected layers, and display the map in a RockPlot2D tab in the Options window.
- You can adjust any of the mapping options along the left and click the Process button to regenerate the map.
! Each time you click the Process button, the existing map display will be replaced.
- View / save / manipulate / print / export the map in the RockPlot2D window. (More.)
See also
 Back to Map Menu Summary

RockWare home page