RockWorks | Utilities | Maps | Polygon Maps | Multiple Polygons -> Grid
Use this program to read a listing of separate polygon files, each containing XY point coordinates, and create a grid model in which the nodes inside the polygons are assigned a specific value. The resulting grid model (.RwGrd file) can be displayed as a 2D map or 3D surface.
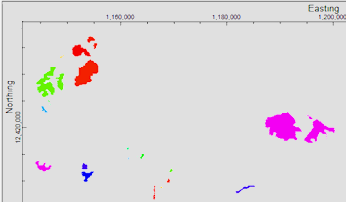
Example: Create a grid model of multiple excavations, for later merging with a ground surface grid model.
See also:
Plotting Multiple Polygons - Simple for simple polygon maps (no grid)
Plotting Multiple Polygons - Advanced for more complicated polygon maps (no grid)
Google Earth Polygon Maps for polygon maps output to Google Earth.
Menu Options
Step-by-Step Summary
Menu Options
- Input Columns: The prompts along the left side of the window tell RockWorks which columns in the input datasheet contain what data.
Click on an existing name to select a different name from the drop-down list. See a sample data layout below.
- Polygon File: Column that contains the names of the external .rwDat files containing the polygon vertices.
Tip: use the File | Import | Create File List program to quickly create a list of specified file names.
- Attribute: Column that contains the numeric values to be assigned to the grid nodes inside the listed polygon.
- Grid Model to be created: Click to the right to type in the name for the RwGrd file to be created.
- Default Attribute Value: Click to the right to type in the numeric value to be assigned to grid nodes which lie outside any of the defined polygons. To use the RockWorks Null Value, type in -1.0e27.
- Create 2-Dimensional Grid Diagram: Insert a check here if you want to display the output grid as a 2D map at this time. Expand this heading to set up the 2D map layers (bitmap, symbols, labels, line contours, color-filled contours, labeled cells, and/or map border).
- To activate a layer, insert a mark in its check-box.
- To access the layer's settings, expand the item by clicking on its "+" button. Then either click on the available button or expand the additional tree menu headings.
- Create 3-Dimensional Grid Diagram: Insert a check here if you want to display the output grid as a 3D surface at this time. Expand this heading to set up the 3D options.
! You can request both a 2D and 3D representation of the grid model.
- Color Scheme: Click on the Options button to the right to access a variety of pre-set color schemes, or to create your own. (More.)
- 3D Surface Options: Click on this button to establish the color and other surface settings.
- Reference Cage: Check this box to include a 3D grid of reference lines and labels with the diagram. Expand this heading to access the cage options.
- Create Grid Statistics Report: Insert a check here if you want to see a report summarizing the output grid.
- Include Standard Deviation: Check this box if you want the report to include standard deviation.
- Include Directional Analysis: Check this box to include slope, aspect, and strike computations. Be warned that these can take a few moments for large grid models.
Step-by-Step Summary
- Access the RockWorks Utilities program tab.
- Create a new datasheet and enter or import your X and Y coordinates into the datasheet.
Or, open one of the sample files and replace that data with your own.
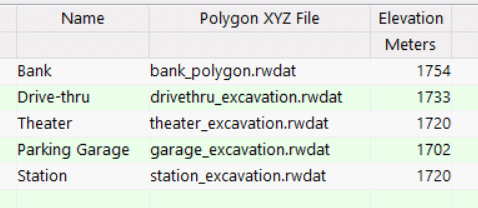
You can use the Columns | Column Properties menu option to establish the file-name column (such as "Polygon XYZ File" shown here) as containing linked data, specifically another .rwDat file. Doing so allows you to double-click in one of the cells to display the contents of the linked file.

Each of the .RwDat files listed here needs to list the X and Y coordinates for the vertices of a single polygon:
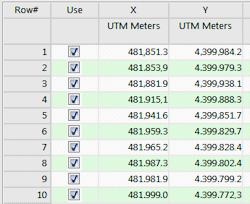
Longitude and latitude coordinates must be in decimal format. If you're using another coordinate system, be sure you've specified the Units and the Projection Settings as appropriate.
- Select the Map | Polygon Maps | Multiple Polygons -> Grid menu option.
- Enter the menu settings as described above.
- Click the Process button to continue.
The program will initialize the grid model using the current Output (Model) Dimensions and the default Z value you specified. It will then determine the location of each polygon and set the node Z values inside each to the defined number.
If requested the program will create a 2- and/or 3-dimensional image representing the grid model. The requested diagram(s) will be displayed in a RockPlot2D tab and/or RockPlot3D tab in the Options window. If you requested a statistics report, it will be displayed in a Text Tab in the Options window.
- You can adjust any of the settings in the Options window and then click the Process button again to regenerate the map(s).
! Each time you click the Process button, the existing display(s) will be replaced.
- View / save / manipulate / export / print the diagram in the RockPlot2D or RockPlot3D window.
 Back to Map Menu Summary

RockWare home page