RockWorks | Utilities | Map | Sphereplot |
3D Projection - Polylines
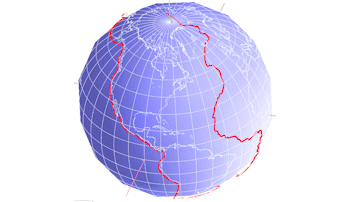
This program creates a dynamic spherical display in RockPlot3D. It reads user-created lists of longitude and latitude coordinates from external files (listed in the datasheet) which define the polygon vertices on the global map. It also offers global reference items (coastlines, islands, rivers) from a program database. (See the EarthApps for polyline maps output to Google Earth.)
Applications include fault lines, movement vectors, etc. Note that our discussion refers to the planet Earth but, aside from the Earth-specific geographical features, you can certainly apply this tool to other spherical bodies.
Menu Options
Step-by-Step Summary
Menu Options
- Input Columns: The prompts along the left side of the window tell RockWorks which columns in the input datasheet contain what data.
Click on an existing name to select a different name from the drop-down list. See a sample data layout below.
- File Name: Select the column in the main datasheet that contains the names of the external text files listing the longitude and latitude coordinates for polyline vertices to be plotted on the map.
- Polyline Color: Click on the color box to choose a color for the polylines.
- Polyline Thickness: Click to specify the thickness for the polylines. 1= thin, 4 = very thick.
- Fixed Radius: Click to the right to enter the distance for the polyline endpoints, in kilometer units. Tip: See the defaults listed below for the different earth and atmospheric structures for reference.
- Spheres: Expand this heading to select which reference spheres, if any, are to be plotted. The kilometer radii listed below are the defaults, but you can modify these as you wish.
- Ionosphere: 6,728 km.
- Mesosphere: 6,468 km.
- Stratosphere: 6,428 km.
- Ozone Layer: 6,423 km.
- Tropopause: 6,398 km.
Troposphere: 6,393 km.
- Crust: 6,378 km. (This is the earth surface.)
- Outer Core: 3,478 km.
- Inner Core: 1,278 km.

- Reference Items: Expand this heading to select how reference longitude and/or latitude lines are to be plotted.
- Longitude Lines: Longitude lines start at the north pole and extend to the south pole. They are oriented exactly north/south. Expand this heading to select the longitude line color, style, and spacing. NOTE: The spacing must be evenly divisible into 360. Examples: 1, 2, 4, 5, 6, 9, 10, 12, 24, etc.
- Latitude Lines: Latitude lines are parallel with the equator. Expand this heading to select the latitude line color, style, and spacing. The spacing must be evenly divisible into 360.
- Geographic Features: Expand this item to select which built-in reference features are to be included in the map. Options include coastlines, major islands, major rivers and lakes, country borders, and/or U.S. state boundaries. To activate an item, insert a check in its check-box and expand it to select line thickness (1 = thin, 3 = thick) and color.
- ! The features are low-resolution. The country boundaries are vintage 1990, and will not reflect more recent political boundary adjustments in eastern Europe, etc.
- Miscellaneous
- Centroid: This setting establishes the coordinate for the center of the sphere around which the point/polyline data items and reference items will plot.
Step-by-Step Summary
- Access the RockWorks Utilities program tab.
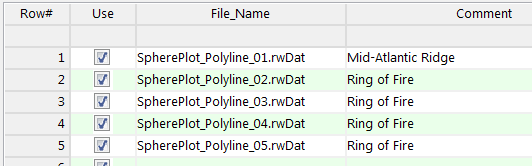
- Create a new datasheet and enter or import your listing of polyline data files into the datasheet.
Or, open one of the sample files and replace that data with your own. (In this example, the sample file = "\RockWorks17 Data\Samples\Sphereplot_Polylines_01.rwDat".) See the Global Map Polyline Data for details.
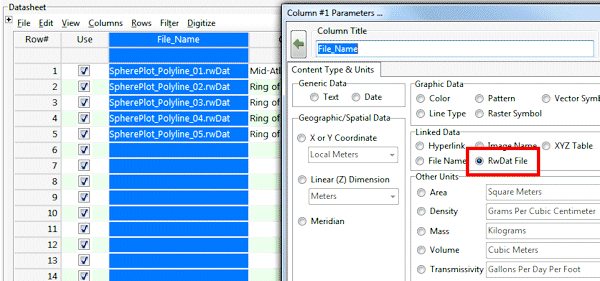
You can use the Columns | Column Properties menu option to establish the file-name column (such as "File_Name" shown here) as containing linked data, specifically another .rwDat file. Doing so allows you to double-click in one of the cells to display the contents of the linked file.
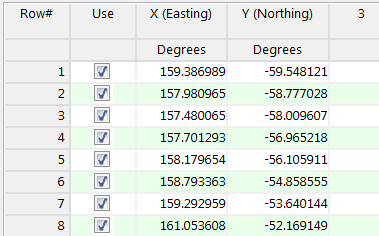
Each of the .RwDat files listed here needs to list the decimal longitude and latitude coordinates for the vertices of a single polygon:
- Select the Map | SpherePlot | 3D Projection - Polylines option.
- Establish the requested menu settings, described above.
- Click the Process button to continue.
The program will create an image that includes the requested point and/or polyline and available reference layers. The completed map will be displayed in a RockPlot3D tab in the options window.
- You can adjust any of the settings in the Options window (symbol options, annotations, etc.) and then click the Process button again to regenerate the 3D diagram.
! Each time you click the Process button, the existing display will be replaced.
- View / save / manipulate / export / print the map in the RockPlot3D window. (You can drill down to the individual components of the 3D view by expanding the Sphere group in the Data pane.)
 Back to Map Menu Summary

RockWare home page