
RockWorks | Utilities | Maps | Line Maps
Use this program to read a listing of XY point pairs from the Utilities datasheet, and create a 2D map with a line segment drawn between these vertices, in a selected line style and color. Symbols and labels can be plotted at the line endpoints.
Example: Map well surface and TD locations with specific symbols, labels, and a connecting line.
Menu Options
Step-by-Step Summary
Menu Options
- Input Columns: The prompts along the left side of the window tell RockWorks which columns in the input datasheet contain the required data.
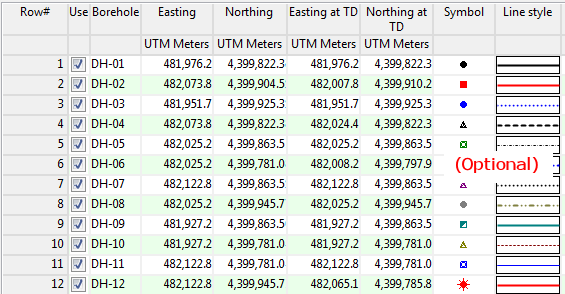
Click on an existing name to select a different name from the drop-down list. See a sample data layout below.
- Pt #1 X: Select the column in the main datasheet that contains the X or Easting coordinates for the starting point of the line.
These can be Eastings in meters or feet, decimal longitudes, etc. See Defining your Datasheet Coordinates for more information.
- Pt #1 Y: Select the column that contains the Y or Northing coordinates for the starting point.
- Pt #2 X: Select the column that contains the X coordinates for the ending point of the line.
- Pt #2 Y: Select the column that contains the Y coordinates for the endpoint.
- Point #1 (Start): Expand this heading to access the settings for the starting point.
- Plot Symbol: Check this option to plot uniform or unique symbols at the starting point of the line. Expand this heading to access the symbol options.
- Symbol Type: Expand this heading to define whether the symbols are to be uniform or unique for each site.
- Fixed: Choose this option to select a single symbol type for all points.
- Symbol: Click to the right to choose the symbol design and color.
- Variable: Choose this option if the symbols are listed in the datasheet.
- Column: Click to the right to choose the name of the column where the symbols are listed.
- Size: Click to the right to type in the size for the symbol. The size is declared as a percent of the project extents.
- Plot Label: Check this option to include labels with the starting symbols. Expand this heading to access the settings.
- Label Type: Expand this heading to define whether the labels are to be uniform or unique for each point.
- Fixed: Choose this to define a single label for each starting point.
- Label: Click to the right to type in the label.
- Variable: Choose this option if the label text is listed in the datasheet.
- Column: Click to the right to choose the name of the column where the label text is listed.
- Size: Click to the right to type in the size for the labels, as a percent of the project extents.
- Point #2 (End): Use these settings to define the symbols and labels for the line endpoint. The options are the same as above.
- Line Style: Expand this heading to define the line characteristics.
- Fixed: Select this to define a uniform line style and color for all lines.
- Style: Click to the right to choose the line style, thickness, and color.
- Variable: Choose this if you have define distinct line styles in the datasheet.
- Column: Click to the right to select the name of the column in which the lines are defined.
- Arrowhead: Check this if an arrowhead is to be included, pointing towards Point #2.
- Type: Choose Filled or Hollow.
- Size: Click to the right to type in the size for the arrowhead, as a percent of your project dimensions.
- Label Offset: Use these settings to specify how point labels (if activated) are to be positioned.
- Automatic: This option allows the program to position the labels automatically, to prevent overplotting.
- Manual: This permits you to define a specific offset for the label from each symbol.
- X-Offset: Click to the right to enter the horizontal offset of the start of each label from each symbol, as a percent of the project size. Positive offset values will shift the label to the right, and negative values to the left.
- Y-Offset: Click to enter the vertical offset for the label from each symbol, as a percent of the project size. Positive offset values will shift the label upward and negative values downward.
- Border: Check this to include a border around the map which shows the coordinate range of the axes. Expand this heading to establish the border options.
Step-by-Step Summary
- Access the RockWorks Utilities program tab.
- Create a new datasheet and enter or import your X and Y coordinate pairs into the datasheet. Here's an example of how this listing might look:
- Select the Map | Line Map menu option.
- Establish the menu settings as described above.
- Click the Process button to create the map.
The program will create the map with the selected symbols, labels, and lines, and display the map in a RockPlot2D tab in the Options window.
- You can adjust any of the mapping options along the left and click the Process button to regenerate the map.
! Each time you click the Process button, the existing map display will be replaced.
- View / save / manipulate / print / export the map in the RockPlot2D window. (More.)
Tip: Use the Borehole Manager's File | Transfer | Locations -> Utilities Datasheet, with "Transfer the coordinates at Total Depth" activated, to get a row-and-column list of your borehole surface and TD locations. Then use this Lines Map program to create a map with symbols at the borehole surface and TD, with lines connecting them to display the well trace.
See also
- Lineation Maps re: simple maps displaying lines without symbols or labels.
 Back to Map Menu Summary

RockWare home page