RockWorks | Utilities | Map | Shotpoints
This program is used to create a map that illustrates shotpoint locations as read from the datasheet. The shotpoint data must include (at minimum) a shotpoint line number, a symbol, and an X and Y coordinate for the individual shotpoint. You may optionally include the point number (not used in the map) and a label for points, typically representing distance. Each seismic line will have two or more data rows containing individual point records.
See also: Importing SEG-P1 Data regarding automatic import of SEG-P1 shotpoint data files.
Menu Options
Step-by-Step Summary
Menu Options
- Input Columns:
- Line Numbers: The program will use this alphanumeric field to group the shotpoints into lines. For data imported using the SEG-P1 import tool, this should read, "Line#".
- Symbols: Select the name of the data column that contains the symbols and colors to be used for the points along the shotpoint lines.
- X (Easting), Y (Northing): Select the data columns that contain the location coordinates for the shotpoints.
- Line Style/Color: Click here to select a style and color for the shotpoint lines.
- Symbol Size: Click here to change the size of the shotpoint symbols, as a percent of the map width.
- Tip: Because the program will scale all symbols at the declared size, you might want to choose smaller symbol styles (such as
 versus
  ) for unlabeled points versus labeled points.
- Labels: Insert a check here if you want the shotpoint map symbols to include labels. Expand this item to establish the label settings.
! Be warned that if you have a lot of points, adding labels may make the map difficult to read, and can require some time for the map to generate.
- Borders: Insert a check here if you want the map's border to include coordinate tick marks and/or axis labels. Expand this heading to establish the border settings.
- Plot All Lines: ! This is an important setting! Insert a check here if you want all seismic lines in the current data file to be plotted. If your data file contains thousands of points, this might create a crowded-looking map. Leave this box cleared if you prefer only selected lines. (You'll have the chance momentarily to select which ones.)
Step-by-Step Summary
- Be sure you have opened, imported, or typed into the main RockWorks datasheet the shotpoint data to be plotted as a map.
- Select the Shotpoints command from the Map menu.
- Enter the requested menu settings, described above.
- Click the Process button to continue.
- If you did not check the Plot All Lines box, you will need to complete these steps.
- The program will now display a listing of all of the lines in the current data file. The line names are taken from the data column you specified for Line #. The names will be listed in the order in which they occur in the data file.
- Select the line(s) to be included in the output map. To select multiple lines, press the <Ctrl> key while you click on the line names. Use the scroll bar as necessary to view names not currently visible.
- Click OK when you are ready to continue.
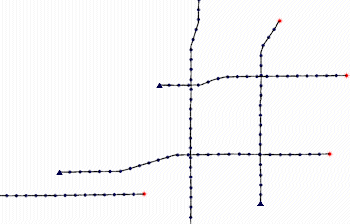
The program will create a map illustrating the shotpoint locations on the selected seismic lines. The completed map will be displayed in a RockPlot2D tab in the options window.
- You can adjust any of the settings in the Options window (scaling, fill colors, etc.) and then click the Process button again to regenerate the map.
! Each time you click the Process button, the existing display will be replaced.
- View / save / manipulate / export / print the map in the RockPlot2D window.
 Back to Map Menu Summary

RockWare home page