RockWorks | Utilities | Map | Sphereplot |
2D Cylindrical Projection - Points
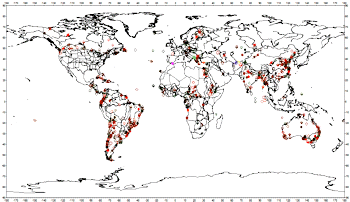
This program creates 2D global maps in a flat, cylindrical projection. It reads user-entered longitude and latitude coordinates from the main datasheet for plotting of individual points on the global map. It also offers global reference items (coastlines, islands, rivers) from a program database. The output map is displayed in RockPlot2D. (See the EarthApps for point maps output to Google Earth.)
Applications include seismic events, volcanoes, ocean temperatures, atmospheric temperatures, and more.
Menu Options
Step-by-Step Summary
Menu Options
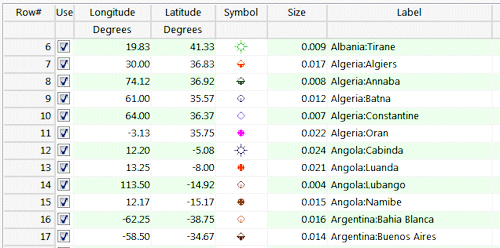
- Input Columns: The prompts along the left side of the window tell RockWorks which columns in the input datasheet contain what data.
Click on an existing name to select a different name from the drop-down list. See a sample data layout below.
- X (Longitude), Y (Latitude): Select the columns in the main datasheet that contain the longitude (east/west) and latitude (north/south) coordinates for individual points to be plotted on the cylindrical map. These selections will be ignored if the Symbols option, below, is not activated.
- Longitudes in the Western Hemisphere (e.g. North & South America) must be entered as negative values.
- Longitudes in the Eastern Hemisphere (e.g. Asia & Australia) must be entered as positive values.
- Latitudes in the Southern Hemisphere (e.g. Australia) must be entered as negative values.
- Latitudes in the Northern Hemisphere (e.g. Siberia) must be enteres as positive values.
- Check this! It will assure that the data is placed on the appropriate side of the planet!
- The longitudes and latitudes must be entered in decimal degrees. If your data is in degrees/minutes/seconds, you must first use the Coords | Coordinate Converter - Multiple Points conversion utility first.
- Symbols: Insert a check here to display the longitude and latitude points with map symbols. Expand this item to establish the symbol settings.
- Labels: Insert a check here if you want the map symbols to include labels. Expand this item to establish the label settings.
- Reference Lines: Expand this item to select whether longitude and latitude lines are to be plotted and, if so, their spacing and color.
- Geographic Features: Expand this item to select which built-in reference features are to be included in the map. Options include coastlines, major islands, major rivers and lakes, country borders, and/or U.S. state boundaries. To activate an item, insert a check in its check-box and expand it to select line style and color.
! The features are low-resolution. The country boundaries are vintage 1990, and will not reflect more recent political boundary adjustments in eastern Europe, etc.
- Border Annotation: Check this box to include axis annotation on the map. Expand this heading to select the annotation items.
- Lon/Lat Border Annotation: Check this box to include longitude labels along the base and top of the map, and latitude labels along the sides of the map.
- UTM Zone Index: Check this box to include labels that indicate the UTM zone.
Step-by-Step Summary
- Access the RockWorks Utilities program tab.
- Create a new datasheet and enter or import your listing the point coordinates to be plotted on the cylindrical global map.
Or, open one of the sample files and replace that data with your own. (In this example, the sample file = "\RockWorks17 Data\ Samples\Sphereplot_Points_01.rwDat".) See the Global Map Point Data for details.
Longitude and latitude coordinates must be in decimal format.
- Select the Map | SpherePlot | 2D Cylindrical Projection - Points menu option.
- Establish the requested menu settings, described above.
- Click the Process button to proceed.
The program will create a map illustrating the point locations, including the requested reference layers. The completed map will be displayed in a RockPlot2D tab in the options window.
- You can adjust any of the settings in the Options window (symbol options, annotations, etc.) and then click the Process button again to regenerate the map.
! Each time you click the Process button, the existing display will be replaced.
- View / save / manipulate / export / print the map in the RockPlot2D window.
 Back to Map Menu Summary

RockWare home page