RockWorks | Utilities | Map | Grid-Based Map
This program is used to:
- Create a grid model (an .RwGrd file) of XYZ data in the Utilities datasheet or in an external ASCII file - OR - read an existing .RwGrd model you've already created, and
- Create a 2-dimensional (flat) map and/or 3-dimensional surface map representing the grid model.
You can use this tool to create a new grid model and a new 2D or 3D map. You can use this tool to create a new grid model only (no map). You can also use this tool to create a new 2D or 3D map from already-existing grid models.
RockWorks offers several different methods to compute the grid model and many different map settings.
Menu Options
Step-by-Step Summary
Menu Options
- Set up the Input Columns (along the left edge of the window). These will be ignored if the data source is an external file.
- X (Easting): Select the column in the main datasheet that contains the X or Easting coordinates to be modeled and mapped.
These can be Eastings in meters or feet, decimal longitudes, etc. See Defining your Datasheet Coordinates for more information.
- Y (Northing): Select the column that contains the Y or Northing coordinates.
- Z (Elevation): Select the column that contains the Z values to be modeled and represented in the contour map. The Z values can be any measured values, such as elevation, quantitative values (geochemistry), qualitative values, percents, etc.
- Dip Gridding: If you are using the Dip Gridding algorithm, you need to define the names of the data columns where the structural measurements are stored. This is applicable to structural elevation data only. These values will be ignored if you are not using the Dip Gridding modeling method. (See Gridding Options, below.)
- Direction: Choose the column in the main datasheet where the strike or dip direction is listed, in a 0 to 360 format. You'll need to define whether these bearings represent strike or dip, below.
- Dip Angle: Choose the column in the main datasheet where the dip angle is listed, where 0 = horizontal and 90 = vertical, downward.
- Direction Represents... Use these settings only if you will be using the Dip Gridding algorithm and have specified input structural direction and angle columns above.
- Strike (Dip Based on "Right Hand Rule"): Choose this option if the Direction values defined above represent the strike bearing, with the dip direction being 90 degrees clockwise (right-hand rule).
- Dip Direction: Choose this option if the Direction values defined above represent the dip bearing.
- Data Source: If you are creating a new grid model (which you'll specify below) you'll need to specify the source of the input data. In the middle pane of the displayed window:
- Datasheet: Choose this option if the data to be gridded is displayed in the current datasheet.
- Specify the appropriate datasheet Input Columns (Easting, Northing, and Z (Elevation)) in the left pane of the window, as described above.
- ASCII File: Choose this option if the data to be gridded is stored in an external text file.
! This can be helpful if you have a large amount of data to be gridded - it's faster to read the data from an external file than to load it into the program's datasheet.
! You cannot include Symbols or Labels for points loaded from an external file.
! RockWorks assumes the units in the external file are the same as your Output Units.
Expand this heading to specify:
- File Name: Click here to browse for the name of the separate ASCII file.
- X-Column, Y-Column, Z-Column: Click on each prompt to specify the column position in the external file for the specified data to be gridded. For example, if the X-coordinates are stored in the first column in the file, you would enter: 1
- Expand the Delimiter item to specify whether the columns in the file are separated by spaces or tab characters.
- Grid Model: Expand this heading to specify the grid source.
- Create New Grid: Click in this radio button to create a new grid model from the datasheet or external file (above). Expand this heading to access the grid model settings.
- Grid Name: Click to the right to enter the name for the new grid model. Use "RwGrd" as the file name extension.
- Gridding Options: Click on this button to access the various gridding options.
- Use Existing Grid: To use a grid that already exists, click in this option, and expand this heading.
- Grid Name: Click here to browse for the existing grid model to be used to create the map. The grid file should reside in the current project folder.
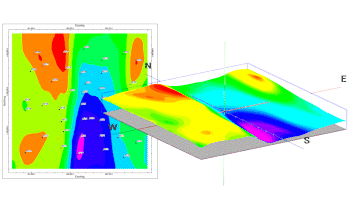
- Create 2-Dimensional Grid Diagram: Insert a check here if you want to display the output grid as a 2D map at this time. Expand this heading to set up the 2D map layers (bitmap, symbols, labels, line contours, color-filled contours, labeled cells, and/or map border).
- To activate a layer, insert a mark in its check-box.
- To access the layer's settings, expand the item by clicking on its "+" button. Then either click on the available button or expand the additional tree menu headings.
- Create 3-Dimensional Grid Diagram: Insert a check here if you want to display the output grid as a 3D surface at this time. Expand this heading to set up the 3D options.
! You can request both a 2D and 3D representation of the grid model.
- Color Scheme: Click on the Options button to the right to access a variety of pre-set color schemes, or to create your own. (More.)
- 3D Surface Options: Click on this button to establish the color and other surface settings.
- Reference Cage: Check this box to include a 3D grid of reference lines and labels with the diagram. Expand this heading to access the cage options.
- Create Grid Statistics Report: Insert a check here if you want to see a report summarizing the output grid.
- Include Standard Deviation: Check this box if you want the report to include standard deviation.
- Include Directional Analysis: Check this box to include slope, aspect, and strike computations. Be warned that these can take a few moments for large grid models.
Step-by-Step Summary
- If you're creating a new grid model, be sure you've got the source data ready:
Datasheet: Create a new datasheet and enter or import the location coordinates for the sites to be displayed in the map, and the z-value column to be contoured. (More.) Or, open one of the sample files and replace that data with your own. You'll need to either enter/import your data into the RockWorks Utilities datasheet, or
External file: Be sure the external ASCII XYZ file exists.
Exiting Grid: If you're creating a map from an existing grid model (.RwGrd file), be sure you have that file ready.
- Access the RockWorks Utilities program tab.
- Click on the Map menu and choose the Grid-Based Map menu option.
- Enter the requested menu settings, described above.
- Click the Process button at the bottom of the window when the grid and map options are established to your satisfaction.
If you have activated the Confirm Intervals setting for either Contour Lines or Color Intervals, the program will display a summary window with default contour intervals.
- Adjust these items if necessary and click OK.
If you have activated the gridding Dimensions / Confirm Dimensions option, the program will display a summary window with the grid boundary coordinates and node spacing.
- You may adjust the grid dimensions as necessary and click OK.
The program will create a new grid model or read the existing grid model, and if requested create a 2- or 3-dimensional image representing the grid model. The requested diagram(s) will be displayed in a RockPlot2D tab and/or RockPlot3D tab in the Options window. If you requested a statistics report, it will be displayed in a Text Tab in the Options window.
- You can adjust any of the settings in the Options window and then click the Process button again to regenerate the diagram(s).
! Each time you click the Process button, the existing display(s) will be replaced.
- View / save / manipulate / export / print the diagram in the RockPlot2D or RockPlot3D window.
See also
- Easy Maps for information about 2D contour maps built on Delaunay contours (no gridding).
- Data Structure for details about setting up your data.
- Gridding Overview for information about the process of gridding.
 Back to Map Menu Summary

RockWare home page