RockWorks | Utilities | Map | Sphereplot |
2D Cylndrical Projection - Polylines
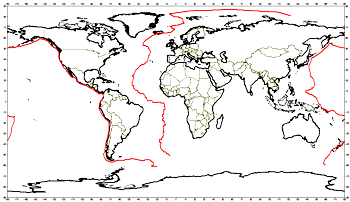
This program creates 2D global maps in a cylindrical (flattened) projection. It reads one or more external files in which longitude and latitude coordinates of polyline vertices are defined, for display of these polylines on the global map. It also offers global reference items (coastlines, islands, rivers) from a program database.
Applications include large-scale fault lines, movement pathways, etc.
Menu Options
Step-by-Step Summary
Menu Options
- Input Columns: The prompts along the left side of the window tell RockWorks which columns in the input datasheet contain what data.
Click on an existing name to select a different name from the drop-down list. See a sample data layout below.
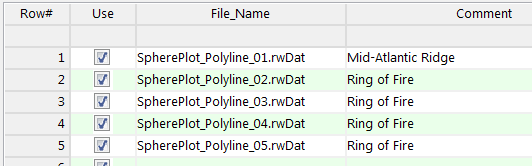
- File Name: Select the column in the main datasheet that contains the names of the external text files listing the longitude and latitude coordinates for polyline vertices to be plotted on the map.
- Polyline Style: Click on the line example to the right to choose a style and color for all of the polylines.
- Reference Lines: Expand this item to select whether longitude and latitude lines are to be plotted and, if so, their spacing and color.
- Geographic Features: Expand this item to select which built-in reference features are to be included in the map. Options include coastlines, major islands, major rivers and lakes, country borders, and/or U.S. state boundaries. To activate an item, insert a check in its check-box and expand it to select line style and color.
- ! The features are low-resolution. The country boundaries are vintage 1990, and will not reflect more recent political boundary adjustments in eastern Europe, etc.
- Border Annotation: Check this box to include axis annotation on the map. Expand this heading to select the annotation items.
- Lon/Lat Border Annotation: Check this box to include longitude labels along the base and top of the map, and latitude labels along the sides of the map.
- UTM Zone Index: Check this box to include labels that indicate the UTM zone.
Step-by-Step Summary
- Access the RockWorks Utilities program tab.
- Create a new datasheet and enter or import your listing of polyline data files into the datasheet.
Or, open one of the sample files and replace that data with your own. (In this example, the sample file = "\RockWorks17 Data\Samples\Sphereplot_Polylines_01.rwDat".) See the Global Map Polyline Data for details.
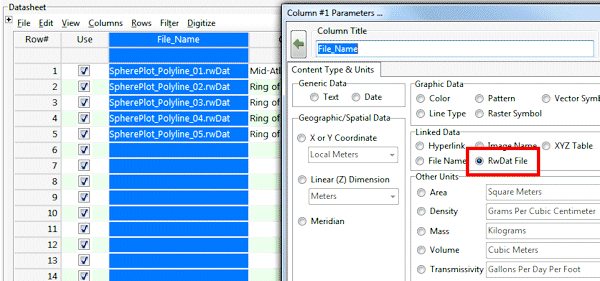
You can use the Columns | Column Properties menu option to establish the file-name column (such as "File_Name" shown here) as containing linked data, specifically another .rwDat file. Doing so allows you to double-click in one of the cells to display the contents of the linked file.
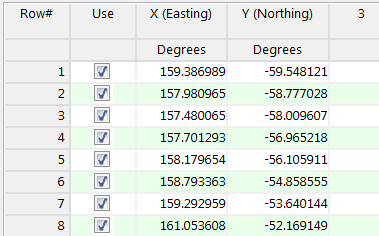
Each of the .RwDat files listed here needs to list the decimal longitude and latitude coordinates for the vertices of a single polygon:
- Select the Map | SpherePlot | 2D Cylindrical Projection - Polylines menu option.
- Establish the requested menu settings, described above.
- Click the Process button to proceed.
The program will create a 2D cylindrical projection map, including the requested reference layers and your listed polylines. The completed map will be displayed in a RockPlot2D tab in the options window.
- You can adjust any of the settings in the Options window (symbol options, annotations, etc.) and then click the Process button again to regenerate the map.
! Each time you click the Process button, the existing display will be replaced.
- View / save / manipulate / export / print the map in the RockPlot2D window.
 Back to Map Menu Summary

RockWare home page