RockWorks | Borehole Operations | Stratigraphy Menu
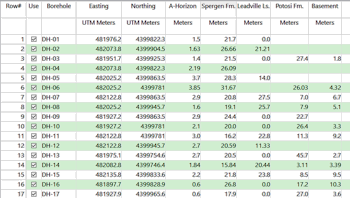
Unlike lithology data, which represents observed rock types which can repeat in a borehole and be inconsistent in order, stratigraphic data represents organized formations, consistent in order between boreholes, and non-repeating within a borehole. RockWorks uses surface modeling or gridding tools to illustrate the stratigraphic layers. Because surface models are created for most of these diagrams, you must have stratigraphic data for at least 4 boreholes.
Use the tools in the Borehole Operations Stratigraphy menu to interpolate and visualize your stratigraphic data in a variety of ways, listed below.
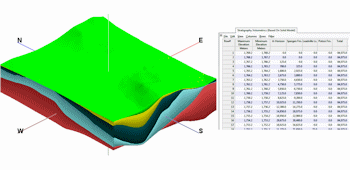
Modeled Stratigraphy Diagrams: Interpolate surfaces for the top and base of all formations, or read existing grid models; the following display options are available.
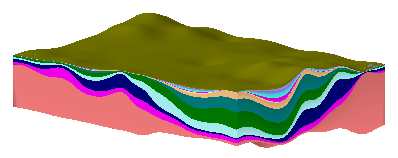
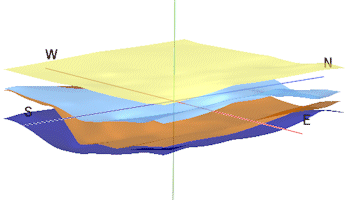
Layered Model: Display surfaces and side panels in 3D. (More info)
Profile: Create a profile diagram sliced between two points in the layered stratigraphy model, with projected striplogs, and color/pattern fills. (More info)
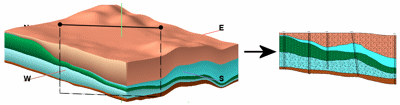
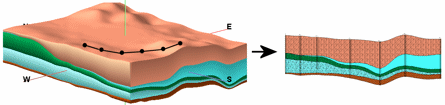
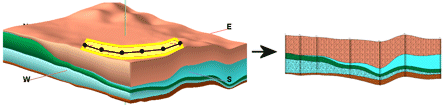
Section - Model-Based: Create a 2D multi-panel cross section, sliced between multiple points in the layered stratigraphy model, with vertical striplogs at panel edges, and color/pattern fills. (More info)
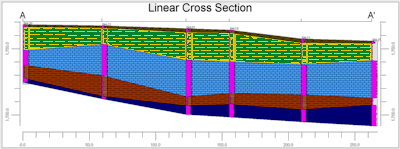
Section - Linear Correlations: Create a 2D multi-panel cross section, with linear correlations drawn between like formations in neighboring holes. Include vertical striplogs at panel edges, and color/pattern fills. (More info)
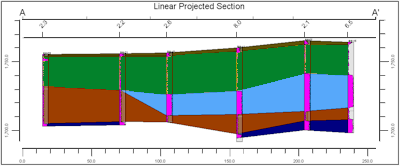
Projected Section - Model-Based: Create a 2D multi-panel cross section, sliced between multiple points in the layered stratigraphy model, with striplogs projected onto panels, and color/pattern fills. (More info)
Projected Section - Linear Correlations: Create a 2D multi-panel cross section, with linear correlations drawn between neighboring holes, with striplogs projected onto panels, and color/pattern fills. (More info)
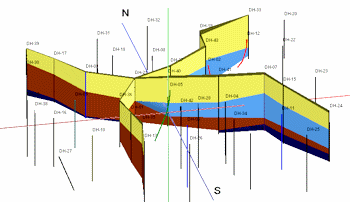
Fence - Model-Based: Create a 3D multi-panel fence diagram, sliced between multiple points in the layered model, with 3D logs and color fills. (More info)
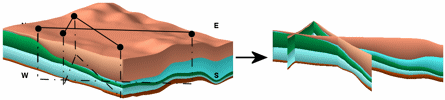
Fence - Linear Correlations: Create a 3D multi-panel fence diagram, with linear correlations drawn between boreholes, with 3D logs and color fills. (More info)
Fence - ESRI - Model-Based: Create a 3D multi-panel fence diagram, sliced between multiple points in the layered model, exported to a 3D Shapefile format. (More info)
Fence - ESRI - Linear Correlations: Create a 3D multi-panel fence diagram, with linear correlations drawn between boreholes, exported to a 3D Shapefile format. (More info)
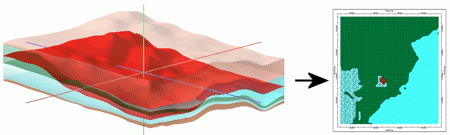
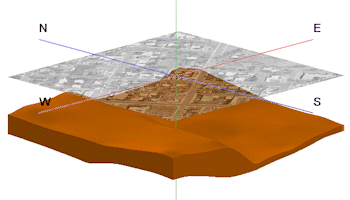
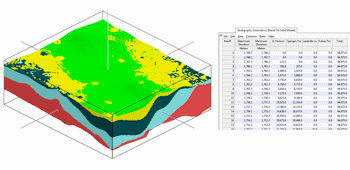
Surface Map: Create a geology map illustrating stratigraphic formations intersected by an existing grid surface. (More info)
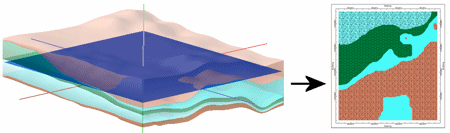
Plan Map: Create a geology map illustrating stratigraphic formations intersected by a horizontal plane. (More info)
Structure and Isopach Maps: Interpolate a surface for the top or base of a selected formations, or for the formation thickness, for display as a 2D map or 3D surface.
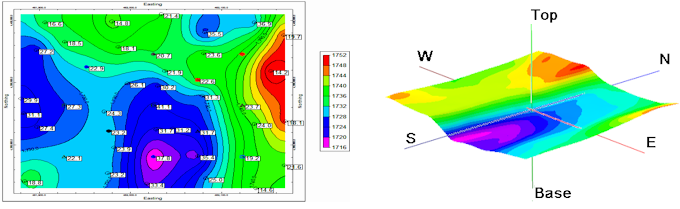
Structure Grid: Interpolate a grid for a selected formation, for display as a 2D map and/or 3D surface. (More info)
3D Stratigraphy Contacts: Create grid models and 3D surfaces for the tops of all formations in the project. (More info)
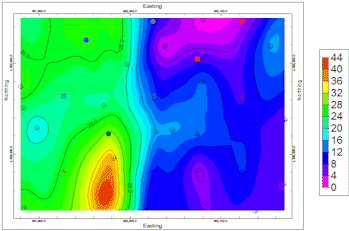
2D Isopach Map: Display the thickness of a single formation or of adjacent formations as a 2D contour map, with a variety of map layers. (More info)
3D Isopach Diagram: Display the thickness of a single formation or of adjacent formations as 3D surfaces with side panels and a variety of map layers. (More info)
Thickness, Volume Reports
Grid Volumetrics: Create a volume report for a grid-based stratigraphy model. (More info)
Solid Volumetrics: Create a volume report for a solid-based stratigraphy model. (More info)
Thickness Report: Create a report of formation thickness based on the borehole database. (More info)
Data Tools
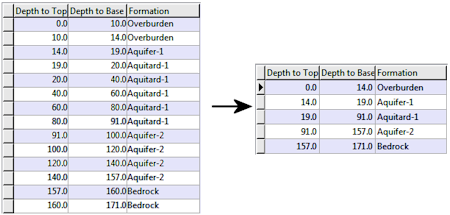
Consolidate: Consolidate contiguous stratigraphic intervals with identical formation names into a single interval. (More info)
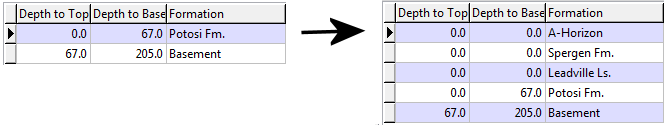
Fill: Compare the stratigraphy data against the Stratigraphy Types table and automatically fill in any missing formations above the borehole bases. (More info)
Manually Build Stratigraphy Diagrams from Existing Grid Models
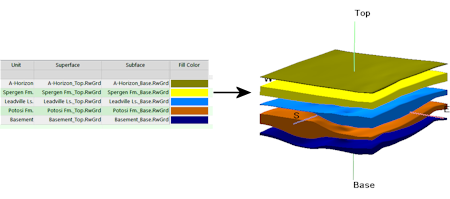
Grids -> 3D Strat Diagram: Create a layered 3D stratigraphy diagram using existing grid models. (More info)
3D Exploded Stratigraphy: Create a layered 3D stratigraphy diagram using existing grid models, with the formations separated ("exploded") vertically for effect. (More info)
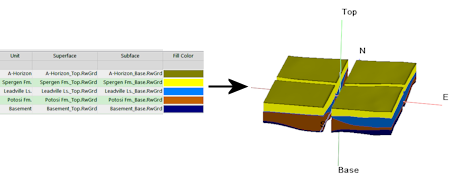
3D Stratigraphic Quadrants: Create a layered 3D stratigraphy diagram using existing grid models, with the diagram split laterally into 4 quadrants. (More info)
 Back to Borehole Manager Summary

RockWare home page