RockWorks | Borehole Operations | Stratigraphy | Fence | ESRI - Linear Correlations
Use this program to create a 3D Shapefile representing stratigraphic fence panels, with straight-line correlations drawn between like formations in adjacent logs. No modeling is done. The stratigraphy layers on the panels will be assigned the name listed in the Stratigraphy Types Table. The completed fence diagram will be saved in the project folder in an ESRI Shapefile format.
See also:
Interpolated Stratigraphic Fence Diagrams (ESRI Shapefiles) for grid-based correlations
Displaying Multiple Logs in 3D with Straight Stratigraphy Correlations for straight fences output to RockPlot3D
What is a Hole to Hole Fence
Feature Level: RockWorks Basic and higher
Menu Options
Step-by-Step Instructions
- Rules & Filters: Use the buttons at the top of the window to apply filters and rules for this program. (More info)
- Spatial Filter: Filter the input data for the stratigraphy fence based on XYZ location.
- Stratigraphic Rules: Apply stratigraphy rules for generating the model.
- Fence Location
Click on this button at the top of the window to draw, on a map display of your enabled boreholes, where the fence panels are to be placed. The most recent fence drawn for this project will be displayed (More info)
! Panels need to be drawn between boreholes.
- Output File
Click on this tab to type in the name for the ESRI Shapefile (SHP) that will be created. The accompanying DBF and SHX files will be assigned the same name.
- Hang Section on Datum
Check this item if you want the fence panels to be built with a particular formation set to "0" elevation. All other data will be plotted relative to that interval.
- Stratigraphic Unit: Click here, and the program will display the formations listed in the current Stratigraphy Types Table. Select the formation on which the fence is to be hung. (More info)
- Access the RockWorks Borehole Manager program tab.
- Enter/import your data into the Borehole Manager database if you have not already done so. This program specifically reads location, orientation (if any), and stratigraphy data. You might also refer to the Missing Formations section regarding the best way to deal with including/not including absent formations.
- Select the Borehole Operations | Stratigraphy | Fence | ESRI - Linear Correlations menu option.
- Enter the requested program settings, described above.
- Be sure to click on the Fence Location tab at the top of the program window to select the fence panel locations.
- Click on the Continue button to proceed.
The program will look at the coordinates specified for each fence panel, snap the endpoints to the closest borehole coordinate if necessary, and construct a vertical panel with linearly-correlated units to illustrate the stratigraphic elevations. This process will be repeated for each fence panel you drew. The resulting data will be stored in three files in your project folder (SHP, SHX, and DBF).
- The resulting Shapefile can be added to ArcScene. You can then use the Properties / Categories tools to display the formation layers as unique values and adjust their colors. Here's an example of stratigraphic fence panels displayed in ArcScene, along with stratigraphy logs (created with the File | Export | Stratigraphy program).
-
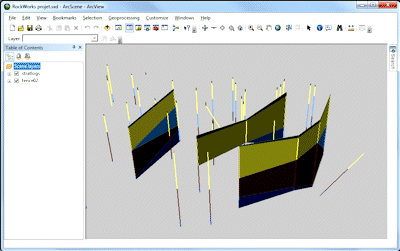
"ArcScene" is a trademark of ESRI Inc.
 Back to Stratigraphy Menu Summary

RockWare home page