RockWorks | Borehole Operations | Stratigraphy | 3D Isopach Diagram
Use this program to:
- Read a listing of stratigraphic contacts from the Borehole Manager database.
- Interpolate a grid model representing the top or base of the selected top formation, across the project area.
- Interpolate a grid model representing the top or base of the selected lower formation, across the project area.
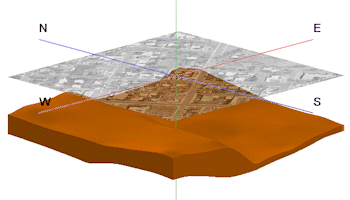
- Create a surface representing the upper-formation's top, a surface representing the lower-formation's base, and enclosing sides.
- Plot the view in RockPlot3D.
- Display the computed volume and mass of the selected formation.
! The mass computation is based on the density per cubic unit as declared in your Stratigraphy Types Table.
Feature Level: RockWorks Standard and higher
Menu Options
Step-by-Step Instructions
- Rules & Filters: Use the tabs at the top of the window to apply filters and rules for this program. (More info)
- Spatial Filter: Filter the input data for the stratigraphy model based on XYZ location, filter the data to be displayed in striplogs, if activated. Note that these tools filter the data that is passed to the modeling and log-generating procedures. This is distinct from the filters that are applied once the model is completed, and described below.
- Time Filter: Filter any T-Data or Aquifer data in striplogs, if activated.
- Stratigraphic Rules: Apply stratigraphy rules for stratigraphic surfaces and logs (if activated).
- 3D Log Design
If you decide to include logs with your stratigraphy model ("Striplogs" setting, below), click on this button at the top of the window to set up how you want the 3D logs to look.
- Visible Items: Use the check-boxes in the first pane to select which log items are to be displayed. See Visible Item Summary for information about the different log items.
- Options: Click on any of the Visible Items names to see the item's settings in the Options pane to the right. See the Visible Item Summary for links to the Options settings.
- Layout Preview: For each item you've activated, you'll see a preview cartoon in the upper pane. Click and drag any item to the left or right to rearrange the log columns. See Using the 3D Log Designer.
-
- Contact Options
Click this tab to specify the formation(s) whose thickness is to be modeled.
- Superface (Top) of Isopach: Click on the formation name to the right to select the stratigraphic unit whose top or base is to represent the upper surface of the isopach model.
- Use Top of Stratigraphic Unit: Click this radio button if the upper surface of the isopach model is to be the top of the selected formation.
- Use Base of Stratigraphic Unit: Click this button if the upper surface of the isopach model is to be the base of the selected formation.
- Subface (Base) of Isopach: Click on the formation name to the right to select the unit whose top or base is to represent the lower surface of the isopach model.
You can specify different formations for the top and the base, and the entire thickness between will be computed. The formation names that are listed here are read from the current Stratigraphy Types Table.
- Use Top of Stratigraphic Unit: Click this radio button if the lower surface of the isopach model is to be the top of the selected formation.
- Use Base of Stratigraphic Unit: Click this button if the lower surface of the isopach model is to be the base of the selected formation.
- Gridding Method
Click on this tab to establish the gridding method (aka algorithm), the grid dimensions, and other gridding options.
- Dimensions: Specify how the grid dimensions are to be established. Unless there's a specific reason to do otherwise, you should probably leave the grid dimensions set to the current output dimensions.
- Algorithms: Select a gridding method from the list, and establish any method-specific options which are displayed.
- Options: Click this tab to establish the other general gridding options (declustering, logarithmic, high fidelity, etc.).
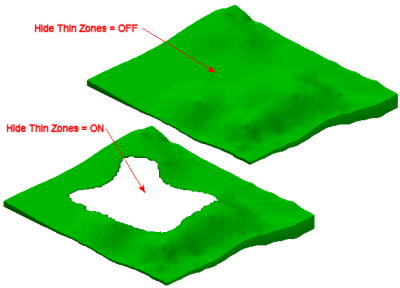
- Hide Thin Zones: Check this box to hide portions of the isopach model that are thinner than a user-specified cutoff.
- Thickness cutoff: Type in the visible threshold. For example, if you wanted the program to hide all zones where the thickness is less than 0.5 feet, you would type in 0.5.
-
- Other 3D Diagram Options
Use these checkboxes to append other layers to your 3D scene.
Click each tab to set up the 3D diagram layers (images, infrastructure, reference cage, etc.).
! If you are including Striplogs, be sure to click on the 3D Log Design button at the top of the window to define the log appearance.
- Output Options
- Save Output File: Check this to assign a name for the 3D scene in advance, rather than displaying it as Untitled.
- Automatic: Choose this option to have RockWorks assign the name automatically. It will use the name of the current program plus a numeric suffix, plus the ".Rw3D" file name extension.
- Manual: Choose this option to type in a name of your own for this RockPlot3D file.
- Display Output: Check this option to have the resulting scene displayed in RockPlot3D once it is created.
Follow these steps to create a 3-dimensional image that represents the thickness of a single stratigraphic unit or adjacent units.
- Access the RockWorks Borehole Manager program tab.
- Enter/import your data into the Borehole Manager database, if you have not already done so. This program specifically reads location, orientation (if any), and stratigraphy data.
- Select the Borehole Operations | Stratigraphy | 3D Isopach Diagram menu option.
- Enter the requested program settings, described above.
- Click the Continue button to proceed.
RockWorks will read the depth intervals for the selected stratigraphic unit(s) as listed in the project's Stratigraphy table. It will internally translate depths to elevations based on the boreholes' surface elevations and downhole surveys. It will create two grid models, of the upper-formation's upper or lower elevations (as selected) and of the lower-formation’s top or base elevations, using the selected gridding method. The display in RockPlot3D will show the upper surface, lower surface, and enclosing sides. In the Data section in the RockPlot3D outline pane, you will see these entities, and the computed volume and mass values. The completed diagram will be displayed in a RockPlot3D tab in the Options window, if requested.
- You can adjust any of the program settings in the Main Options tab and click the Continue button to regenerate the grid models and the surfaces.
- View / save / manipulate / print / export the image in the RockPlot3D window.
- Turn on/off the upper and lower surfaces or sides using the check-boxes in RockPlot3D's Data section.
- To adjust the surfaces' or sides' appearance (color or transparency), double-click on the formation's "Top" or "Base" or "Sides" entry.
- To adjust the vertical exaggeration, use the View | Dimensions menu option or click on the toolbar’s Stretch button.
- To add an already-saved 3D image of the project's striplogs, for example, or another thickness image, choose the File | Append command.
 Back to Stratigraphy Menu Summary

RockWare home page