Borehole Operations | Stratigraphy | Fence | Linear Correlations
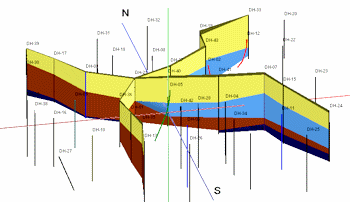
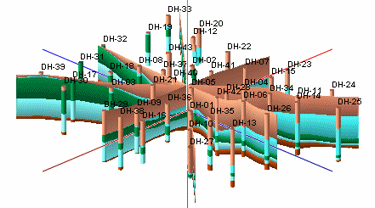
Use this program to create one or more 3D vertical panels between boreholes, on which stratigraphic units are correlated with straight lines. The stratigraphy layers on the panels will be color-coded based on the formation's background color in the Stratigraphy Types Table. 3D logs and other layers can be appended. The completed diagram will be displayed in RockPlot3D.
Panels must be drawn between boreholes. They can be drawn between vertical, inclined, and deviated holes; for the latter the panels are connected to interval tops and bases only.
See also:
Interpolated Stratigraphic Fence Diagrams for grid-based stratigraphic fence diagrams
Log-Only 3D diagrams
What is a Hole to Hole Fence
Feature Level: RockWorks Basic and higher
Menu Options
Step-by-Step Instructions
- Rules & Filters: Use the buttons at the top of the window to apply filters and rules for this program. (More info)
- Spatial Filter: Filter the input data for the stratigraphy fence based on XYZ location, filter the data to be displayed in striplogs, if activated.
- Time Filter: Filter any T-Data or Aquifer data in striplogs, if activated.
- Stratigraphic Rules: Apply stratigraphy rules for drawing the correlations and for display of stratigraphy data in striplogs, if activated.
- 3D Log Design
Click here to choose which data items are to be displayed in the logs, if activated via the Striplogs checkbox below. See Using the 3D Log Designer and the Visible Item Summary.
- Fence Location
Click on this button at the top of the window to draw, on a map display of your enabled boreholes, where the fence panels are to be placed. The most recent fence drawn for this project will be displayed (More info)
! Linear correlation panels must be drawn between boreholes.
- Location Map
Check this box to create, along with the section, a reference map that shows the section's location. It can be embedded in or created separately from the cross-section.
Click on this tab to establish the map options. (More info.)
- Faulting
Click on this tab to enable the display of faults and to modify fault options. (Read this for more details.)
-
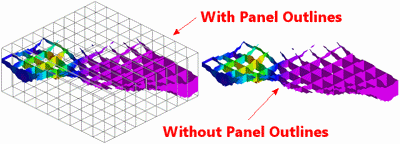
- Panel Borders
Check this box to include a solid-line outline around each fence panel.
Click on this tab to define the line style and color.
-
- Surface Profile
Insert a check here to include a solid line profile on each fence panel that represents a user-selected grid model, such as a water level surface or the ground surface.
Click on this tab to select the grid model to be represented in the fence diagram, and to establish the profile settings. (More info)
-
- Striplogs
Check this item to include 3D logs with the stratigraphy fence display. Note that 3D logs for all active boreholes will be appended to the fence diagram.
Click the 3D Log Design button at the top of the window to set up how you want the logs to look.
Click on this tab to establish some additional striplog settings.
- Clipping Dimensions: Insert a check in the X, Y, and/or Z axis options if you want to restrict the logs to a particular spatial area. (More info)
-
- Location Map
Insert a check here to have the program create, along with the fence diagram, a reference map that shows the fence panel locations.
Click on this tab to set up the map options. (More info)
-
- Other 3D Diagram Options: Use these checkboxes to append other layers to your 3D scene. (Summary)
- Draped Image: Include an image in this 3D scene, draped over an existing grid surface. (More info)
- Floating Image: Include an image in this 3D scene, floating at a specified elevation. (More info)
- Perimeter Cage Include a 3D reference cage around the fence diagram. (More info)
- Legends: Include one or more legends with the diagram.(More info)
- Infrastructure: Display buildings, pipes, or other infrastructure with your 3D scene. (More info)
- Faults: Include 3D fault ribbons with this scene. (More info)
- Other 3D Files: Include other, existing, RockPlot3D ".Rw3D" files in this scene. (More info)
- Output Options
- Save Output File: Check this to assign a name for the 3D scene in advance, rather than displaying it as Untitled.
- Automatic: Choose this option to have RockWorks assign the name automatically. It will use the name of the current program plus a numeric suffix, plus the ".Rw3D" file name extension.
- Manual: Choose this option to type in a name of your own for this RockPlot3D file.
- Display Output: Check this option to have the resulting scene displayed in RockPlot3D once it is created.
- Access the Borehole Manager program tab.
- Enter/import your data into the Borehole Manager database if you have not done so already.
You might refer to the Stratigraphy Rules and Missing Formations topics regarding the best way to deal with including/not including absent formations.
- Select the Borehole Operations | Stratigraphy | Fence | Linear Correlations menu option.
- Enter the requested program settings, described above
- If you are including logs, be sure to click on the 3D Log Design button at the top of the window to establish how you want the logs to look.
- Be sure to click on the Fence Location button (top of window) to select the fence panel locations. For this type of diagram, the panels need to be drawn between boreholes.
- Click on the Continue button to create the straight-line fence diagram.
The program will look at the coordinates specified for each fence panel, snap the endpoints to the closest borehole coordinate if necessary, and construct a vertical panel with linearly-correlated units to illustrate the stratigraphic elevations. The intervals will be filled with the background colors defined for the strata in the Stratigraphy Types Table. This process will be repeated for each fence panel you drew. Other layers (logs, reference cage, etc.) will added to the fence panels. The completed view will be displayed in a RockPlot3D tab in the Options window if requested.
- You can adjust any of the program settings in the Options tab and then click the Continue button again to regenerate the fence diagram.
- View / save / manipulate / print / export the fence in the RockPlot3D window.
In RockPlot3D you can turn on/off entire panels as well as specific layers within each panel. Expand the Stratigraphy Fence item in the Data listing to access these settings.
 Back to StripLogs Menu Summary

RockWare home page