RockWorks | Borehole Operations | Stratigraphy | Structure Grid
Use this program tool to:
- Read data for the top or base of a selected stratigraphic contact from the Borehole Manager database.
- Interpolate a grid model representing those elevations across the project area.
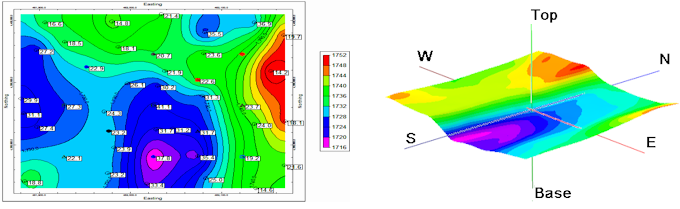
- Create a (flat) contour map representing the grid model, with a variety of map layers, for display in RockPlot2D, and/or
- Create a 3D surface representing the grid model, with a variety of layers, for display in RockPlot3D.
See also
Create 3D Stratigraphic Surfaces of All Formations
Feature Level: RockWorks Standard and higher
Menu Options
Step-by-Step Instructions
- Rules & Filters: Use the tabs at the top of the window to apply filters and rules for this program. (More info)
- Spatial Filter: Filter the input data for the surface model based on XYZ location, filter the data to be displayed in striplogs, if activated. Note that these tools filter the data that is passed to the modeling and log-generating procedures. This is distinct from the filters that are applied once the model is completed, and described below.
- Time Filter: Filter any T-Data or Aquifer data in striplogs or map layers, if activated.
- Stratigraphic Rules: Apply stratigraphy rules for stratigraphic surfaces and logs (if activated).
- 3D Log Design
If you decide to include logs with your 3D surface ("Striplogs" setting, below), click on this button at the top of the window to set up how you want the 3D logs to look.
- Visible Items: Use the check-boxes in the first pane to select which log items are to be displayed. See Visible Item Summary for information about the different log items.
- Options: Click on any of the Visible Items names to see the item's settings in the Options pane to the right. See the Visible Item Summary for links to the Options settings.
- Layout Preview: For each item you've activated, you'll see a preview cartoon in the upper pane. Click and drag any item to the left or right to rearrange the log columns. See Using the 3D Log Designer.
-
- Horizon
Click this tab to select the formation to be mapped.
- Stratigraphic Unit: Click on the formation name to the right to select the unit you wish to view in the map. The units that are displayed are read from the project's Stratigraphy Types Table.
- Select which surface to model:
- Superface: Click in this radio button to model the formation top.
- Subface: Click in this button to model the formation base.
- Output Grid: Click on the small open-file button to the right
 to enter the name for the grid file that will contain the model for the stratigraphic surface. The program will append the .RwGrd file name extension.
- Gridding Method
Click on this tab to establish the gridding method (aka algorithm), the grid dimensions, and other gridding options.
- Dimensions: Specify how the grid dimensions are to be established. Unless there's a specific reason to do otherwise, you should probably leave the grid dimensions set to the current output dimensions.
- Algorithms: Select a gridding method from the list, and establish any method-specific options which are displayed.
- Options: Click this tab to establish the other general gridding options (declustering, logarithmic, high fidelity, etc.).
- 2D Grid Map
Check this box to display the output grid as a 2D map at this time.
Click this tab to set up the 2D map layers (bitmap, symbols, labels, line contours, color-filled contours, labeled cells, map border, etc.).
- Output Options
- Save Output File: Check this to assign a name for the map in advance, rather than displaying it as Untitled.
- Automatic: Choose this option to have RockWorks assign the name automatically. It will use the name of the current program plus a numeric suffix, plus the ".Rw2D" file name extension.
- Manual: Choose this option to type in a name of your own for this file.
- Display Output: Check this option to have the resulting map displayed in RockPlot2D once it is created.
- 3D Grid Diagram
Check this box to display the output grid as a 3D surface at this time.
Click this tab to set up the 3D map layers (surface colors, images, reference cage, etc.).
! You can request both a 2D and 3D representation of the grid model.
- Output Options
- Save Output File: Check this to assign a name for the 3D scene in advance, rather than displaying it as Untitled.
- Automatic: Choose this option to have RockWorks assign the name automatically. It will use the name of the current program plus a numeric suffix, plus the ".Rw3D" file name extension.
- Manual: Choose this option to type in a name of your own for this RockPlot3D file.
- Display Output: Check this option to have the resulting scene displayed in RockPlot3D once it is created.
-
Follow these steps to create a 2D contour map and/or 3D surface of the upper or base elevations of a single stratigraphic unit.
- Access the RockWorks Borehole Manager program tab.
- Enter/import your data into the Borehole Manager database, if you have not done so already. This program specifically reads location, orientation (if any), and stratigraphy data.
- Select the Borehole Operations | Stratigraphy | Structure Grid menu option.
- Enter the requested program settings, described above.
- Click the Continue button to proceed.
The program will read the depth intervals for the selected stratigraphic unit as listed in the project's Stratigraphy data tables. It will internally translate depths to elevations based on the boreholes' surface and downhole surveys. It will create a grid model of the layer's upper or lower elevations using the selected gridding method, and from this model it will create the requested map type with the selected layers. The output will be displayed in a RockPlot2D tab and/or RockPlot3D tab in the Options window.
- You can adjust any of the program settings in the Main Options tab, and click the Continue button again to regenerate the grid model and the map.
- View / save / manipulate / print / export the map in the RockPlot2D and/or RockPlot3D windows.
 Back to Stratigraphy Menu Summary

RockWare home page