 Stratigraphy Types Tables
The Borehole Manager database uses Stratigraphy data tables for entry of depth intervals and formation layer names for each borehole. These formations can be illustrated in strip logs, as surface maps, fence diagrams, and more using the program's Stratigraphy tools.
The Stratigraphy Types Table defines for the program the names of the formations for the current project, the graphic pattern / color to use for each formation in logs and other diagrams, the order of the formations (upper to lower), and other items. It serves as the reference library for the downhole stratigraphic data. This table is stored in the project database and links to your stratigraphy data.
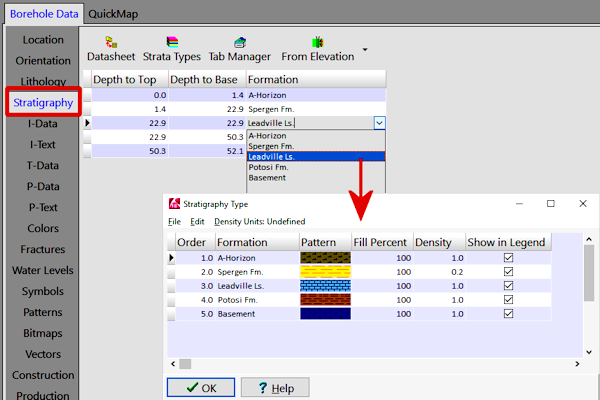
The Stratigraphy Types Table lists for each formation:
- The formation's order, from the ground downward. (This "G" value will also be assigned for that layer in stratigraphic solid models, should you decide to save them.)
! If possible, each unit should have a unique number, and these should increase for each deeper formation. However, if your stratigraphic sequence is poorly defined (as in some imported datasets), then you can use the Stratigraphy Rules to compensate for this.
- The formation name. This field will link to the Stratigraphy data table.
- The pattern and colors to be used to represent the formation in diagrams. Double-click on the pattern cell to choose the pattern design, foreground color, and background color.
! Don't use white for all of the pattern backgrounds because the different formations won't show up in 3D models and 3D logs, which use only the background colors.
- The percent fill for the pattern, which determines how much of the striplog column width the pattern will fill. This is used for striplogs only.
- The formation's density, which is used only for volume/mass computations.
- Whether the formation is to be displayed in any diagram legends and in the pop-up list linked to the stratigraphy data tables. This setting can also be used to define whether the unit is to be included in stratigraphy models and diagrams.
 Back to Tables summary

RockWare home page