RockWorks | Borehole Operations Menu
Use the tools in the RockWorks Borehole Operations menu to read subsurface data from the Borehole Database, and generate maps, logs, cross sections, fence diagrams, 3D models, reports, and more.
These tools are summarized below. Click on the links or the image above to jump to topics with more information.
![]() Back to RockWorks Intro
Back to RockWorks Intro
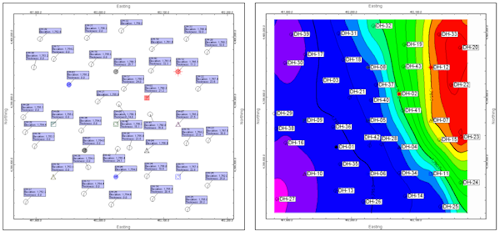
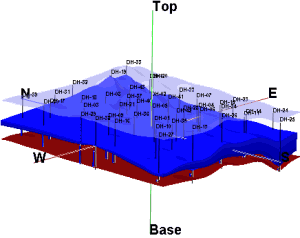
Maps: Create maps that illustrate borehole locations with symbols, mini-logs, projected logs, ground surface contours, contours of optional fields.
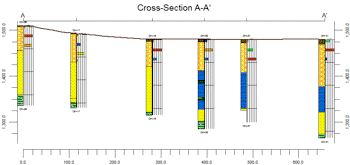
Striplogs: Display observed downhole data in a variety of log and log section diagrams, in 2D and 3D, and create survey reports.
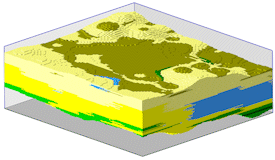
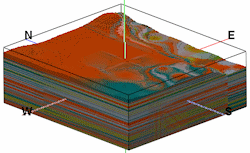
Lithology: Lithology modeling and display tools.
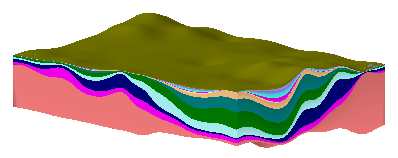
Stratigraphy: Stratigraphy modeling and display tools.
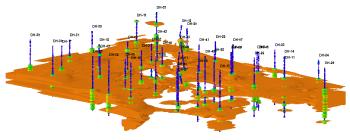
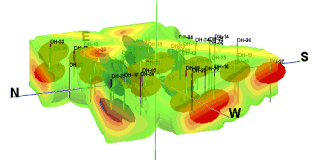
I-Data: Modeling, display, and analysis tools for quantitative data (geochemistry, geotechnical).
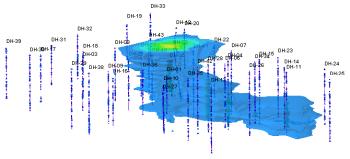
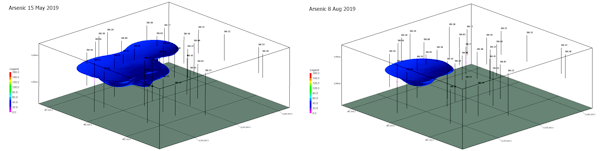
T-Data: Modeling, display, and analysis tools for time-based quantitative data (geochemistry).
P-Data: Modeling, display, and analysis tools for point-sampled quantitative data (geophysical, geotechnical).
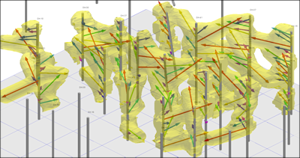
Fractures: Modeling, display, and analysis tools for downhole fracture data (depth, bearing, angle).
Aquifers: Modeling and display tools for aquifer data entered into the Water Levels table.
Colors: Modeling and display tools for color data - general descriptions, Munsell colors, etc..
Vectors: Modeling and display tools for vector data, to illustrate caverns.
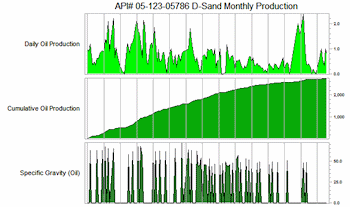
Production: Read oil and gas production data from the database and generate 2D and 3D production diagrams.
![]() Back to RockWorks Introduction
Back to RockWorks Introduction
![]()