RockWorks | Borehole Operations | Stratigraphy | Plan Map
Use this program to:
- Interpolate grid models for the upper and lower surfaces of the project's stratigraphic units (all units or selected ones)
- OR -
Read grid models that you've already created, and...
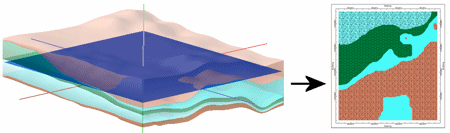
- Determine where these grid models intersect a horizontal plane, creating a geological map based on downhole stratigraphic data, for display in RockPlot2D.
See also
Stratigraphy-Based Geology Maps for stratigraphy maps that intersect a surface.
Feature Level: RockWorks Standard and higher
Menu Options
Step-by-Step Summary
- Rules & Filters: Use the buttons at the top of the window to apply filters and rules for this program. (More info)
- Spatial Filter: Filter the input data for the stratigraphy model based on XYZ location. Note that these tools filter the data that is passed to the modeling procedure. This is distinct from the filters that are applied once the model is completed, and described below.
- Time Filter: Filter any T-Data or Aquifer data in other map layers, if activated.
- Stratigraphic Rules: Apply stratigraphy rules for stratigraphic surfaces.
-
- Stratigraphic Units
Click this tab to define which of your formations are to be included in the modeling and display. (More info)
- All Stratigraphic Units: Choose this if all units are to be modeled (if Interpolate Surfaces is checked, below) and processed for the surface map display.
- Only Units Flagged As "Show In Legend": You can limit the interpolation (Interpolate Surfaces checked) and display to only those formations with a check in the Show in Legend check-box, in the Stratigraphy Types table.
 Interpolate Surfaces: When this option is checked, the program will interpolate grid models for the top and bottom of all/selected stratigraphic units (as specified above).
 Interpolate Surfaces: When this option is not checked the program will assume that the grids already exist, from a previous pass with a Stratigraphy menu option, from making custom edits to the grids, from importing them from another source, etc. In other words, you may not want to create new grid models every time that you generate a diagram.
! IMPORTANT NOTE: The existing grid models must follow the automatic naming scheme: Models for formation tops are named formation_top.RwGrd and those for formation bases are named formation_base.RwGrd, where formation is the exact name of the formation as defined in the Stratigraphy Types Table. The program will assume these grids exist if Interpolate Surfaces is turned off.
Options: If you have Interpolate Surfaces turned ON, click the Interpolate Surfaces tab to set up the modeling options in the tabs to the right.
- Gridding Method: On this tab you can establish the gridding method, the grid dimensions, and other gridding options.
- Dimensions: Use this tab to specify how the grid dimensions are to be established. Unless there's a specific reason to do otherwise, you should probably leave the grid dimensions set to the current project dimensions.
- Algorithms: Select a gridding method for the interpolation of the surfaces.
- Options: Establish the other general gridding options (declustering, logarithmic, high fidelity, etc.).
- Modeling Sequence: Click on this tab to tell RockWorks whether the formations are to be modeled as entered, from the base upward, or from the top down.
- None: Choose this option to model the formations based on the data as entered, with any applicable rules you have activated.
- Base-to-Top (Onlap): Click in this option to "fix" stratigraphic models in which portions of an upper unit extend below the base of a lower unit. The program will give lower units "priority," building model from the bottom-up.(More.)
- Top-to-Base (Underlap): Choose this option to give priority to upper units instead. Any portions of lower units which extend above the base of an upper unit will be constrained to the base of that unit. (More.)
- Constraining Surface: Insert a check here if you want the stratigraphy model to be filtered with a surface, typically representing the ground surface.
! This model must have the same dimensions and node spacing as is represented in the stratigraphy model surfaces. If you need to resample the ground surface grid, refer to the ModOps Grid | Math | Resample option. Click to the right to specify the name of the ground surface grid model (.RwGrd) and the filtering direction. (More info)
- Polygon Filter: Activate this option to remove portions of the stratigraphic surfaces that lie either the inside or outside of a user-defined polygon. (More info)
- Baseplate: Check this option if you want the base of the lowest formation to be extended down to a set elevation. This is helpful for data sets missing depth-to-base values in the lowest formation (boreholes never reach the bottom). (More info)
-
- Output Grid
Click here to type in the name to assign the output grid that will be created. This grid model's nodes will be assigned the "1"s "2"s "3"s, etc., that represent your stratigraphic formations (defined in the Order column in your Stratigraphy Types Table) as they appear at the selected elevation. (You'll choose the elevation level after setting up the menu options.)
- Slice Selection
Click here to define how you want to define the elevation location for the map.
- Select Interactively During Processing: Click here to have the program display a window, after you click the Continue button, where you can interactively select the elevation for the map slice.
- Preselect: Choose this to define the elevation in advance, and enter that elevation (in project units) into the prompt. If you are including this program in a Playlist or Command script, you'll need to pre-select the elevation.
- Diagram Options
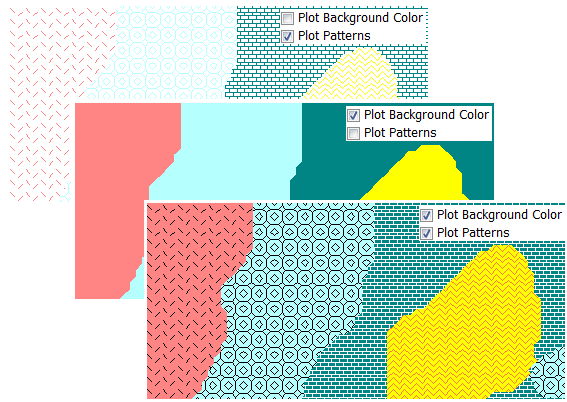
- Plot Background Color: Insert a check here to display the stratigraphy zones using the background colors defined in the current Stratigraphy Types Table.
- Plot Patterns: Check this item to use the graphic patterns, established in the current Stratigraphy Types Table, to represent the formation representation in the output map.
-
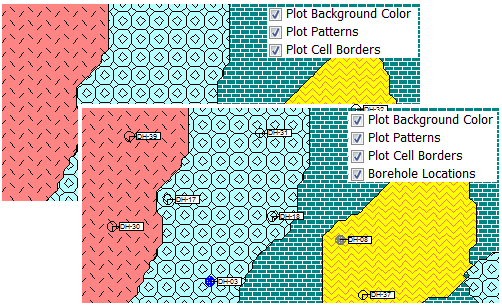
- Plot Cell Borders: Check this box to display the grid model's cell borders either around all cells or around contiguous formation zones.
- Bevel Edges: Check this box to draw borders only around contiguous zones, and to "bevel" the corners so that they're not sharp 90-degree angles. Leave this box cleared to display borders around all grid cells.
- Line Style: Click here to define the line thickness, style, and color for the borders.
-
-
- 2D Map Options
Use these checkboxes to append other layers to your map.
Click each tab to set up the 2D map layers (bitmap, map peripherals, legends, map border, etc.).
- Output Options: Use these settings to define whether the output graphic is to be saved (or displayed as "untitled"), how the file should be named, and whether it is to be displayed after it is created. It also offers export options. (More info)
Follow these steps to create a 2-dimensional map that displays the stratigraphy types that lie at a specific elevation:
- Access the RockWorks Borehole Manager program tab.
- Enter/import your data into the Borehole Manager, if you have not done so already. This program specifically reads location, orientation (if any), and stratigraphy data.
- Select the Borehole Operations | Stratigraphy | Plan Map menu option.
- Enter the requested program settings, described above
- Click on the Continue button to create the stratigraphy plan map.
RockWorks will use the selected settings to create grid models of the stratigraphy layers (tops and bases) in the project. It will then build a temporary solid model from the bottom-up, by "stacking" the grid surfaces.
- If you have chosen interactive slice selection, RockWorks will display a window listing all of the elevation levels in the stratigraphy model. Choose the elevation to be represented in the plan-view map, and click OK.
The program will determine the stratigraphy type for each node at the specified elevation and store that in the output grid model.
It will then create the 2D stratigraphy (geology) map using the requested diagram settings. The completed diagram will be displayed in a RockPlot2D tab in the Options window if requested.
- You can adjust any of the program settings in the Main Options tab and then click the Continue button again to regenerate the map.
! * If the stratigraphy surfaces look OK and you just need to adjust one of the diagram settings, you don't need to keep re-gridding over and over: Un-check Interpolate Surfaces and the map will be built with the new diagram settings from the existing grid models.
- View / save / manipulate / print / export the map in the RockPlot2D window.
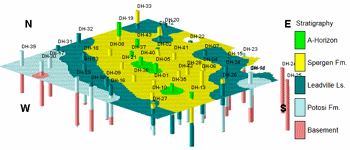
- Use RockPlot2D's File | Export | RockPlot3D tool to float this 2D image at a specific elevation, to transform your 2-dimensional map into a 3-dimensional view. This should be done on 2D stratigraphy surface maps that are not annotated with border text and legends. The legend can be annotated in RockPlot3D itself.
 Back to Stratigraphy Menu Summary

RockWare home page