Use this program to:
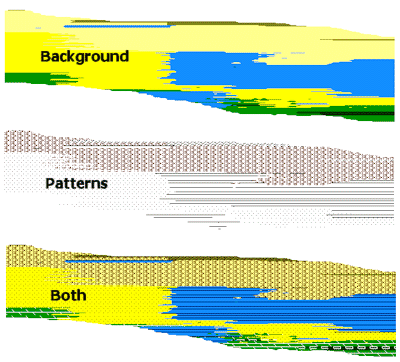
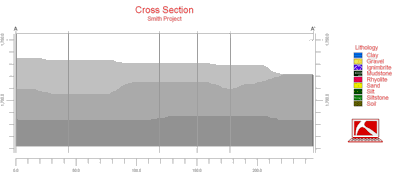
The lithologies will be represented in the model using the numeric "G-values" declared in the Lithology Types Table. The lithologies will be represented in the section diagram with the background color and/or pattern defined for the rock type in the Lithology Types Table.
This type of cross section is very handy for projects when the desired cross section location is not specific to the borehole locations, but to another geographic features (roadway, etc.).
See also
Lithology Profiles for single-panel displays with projected logs.
Feature Level: RockWorks Standard and higher
Menu Options
Step-by-Step Summary
If you've selected Use Existing Model, the program will load the information from the existing lithology model (.RwMod file), and will proceed to diagram generation.
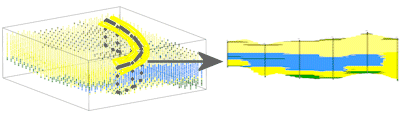
If you've selected Create New Model, the program will scan the project database and extract the borehole locations, lithology depths and materials, and any borehole orientation. It will apply any source data filters you have requested, and will interpolate the solid lithology model.
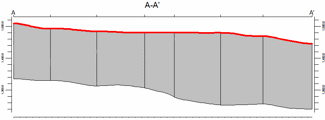
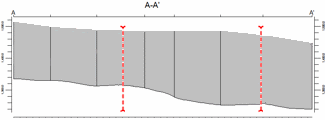
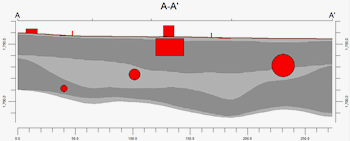
The program will then look at the coordinates specified for the section panels and determine the closest nodes along the cut in the brand-new model, if created, or in the existing model. It will construct a vertical profile for each panel to illustrate the lithology types, using the rock types' background colors and/or patterns specified in the Lithology Types Table, as requested. The panels will then be appended together to create the multi-panel section. If requested, logs will be projected onto the section panels and a section location map will be appended. The completed diagram will be displayed in a RockPlot2D tab, if requested.
! * If the lithology model looks OK and you just need to adjust one of the diagram settings, you don't need to keep re-interpolating the model. Choose Use Existing Model and browse for the lithology .RwMod file to be used for the section.
![]() Back to Lithology Menu Summary
Back to Lithology Menu Summary
![]()