It will display the well locations as a plan-view map, with boring name and symbol color tied to each well. Any previous panels drawn for this project will also be displayed on the map.
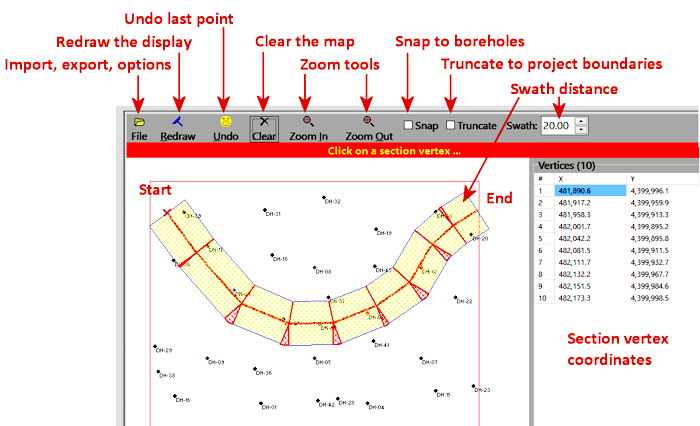
- Reset the display (if necessary): Rockworks will remember any panel selections for this project from previous sessions. If you wish to discard any existing selections and start panel-picking from scratch, click the Clear button at the top of the screen (also present in the Edit menu).
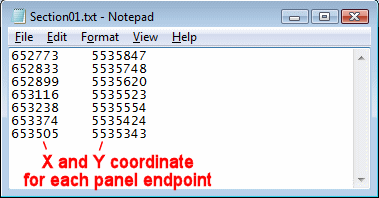
! DON'T do this if you want to append to an existing section. - Pick the first panel endpoint / Append another panel: Click on the location to be represented along the left edge of the first panel of the projected section. If you are appending to an existing trace, pick the location for the next panel to be added to the existing list. The program will draw a line from the last endpoint to this one. The X and Y coordinates for this point will be posted to the vertex listing to the right.
- Pick the next endpoint, and the next and the next. Each selected panel point will be connected to the previous selection with a line, and its coordinates posted to the list.
- Select the View | Zoom In command or click on the
 button at the bottom of the window.
 - Draw a rectangular area to be enlarged: Position the pointer on the map display where one corner of the enlarged area should be. Click and hold the left mouse button. Drag the mouse to the opposite corner of the area to be enlarged and release the mouse button. For your reference the enlargement rectangle will be displayed temporarily. When you release the mouse button, the program will magnify the selected map area.
- Select the View | Zoom Out command or click on the
 button at the bottom of the window. The program will redraw the window to the original display, including all enabled boreholes.