RockWorks | ModOps | Solid | Create | XYZG -> Solid
This program is used to:
- Create a solid model (an .RwMod file) of XYZG data in the RockWorks datasheet
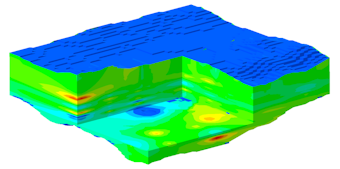
- Create a 3-dimensional isosurface diagram or all-voxel diagram representing the solid model.
RockWorks offers several different methods to interpolate the solid model and many different display settings. The values to be modeled - "G values" - can represent geochemical concentrations, geophysical measurements, geotechnical parameters, etc.
See also
Create Solid Models from ASCII XYZG Data for creating a model from data in an external file.
The Borehole Manager's Lithology, I-Data, T-Data, P-Data, Fracture, Color, and Vector programs for creating solid models for downhole data entered in the borehole database.
Feature Level: RockWorks Basic and higher
Menu Options
Step-by-Step Summary
- Rules & Filters: Use the buttons at the top of the window to apply filters and rules for this program. (More info)
- Spatial Filter: Filter the input data for the solid model based on XYZ location, filter the data to be displayed in striplogs, if activated. Note that these tools filter the data that is passed to the modeling and log-generating procedures. This is distinct from the filters that are applied once the model is completed, and described below.
- Time Filter: Filter any T-Data or Aquifer data in striplogs, if activated.
- Stratigraphic Rules: Apply stratigraphy rules for Stratigraphy data in striplogs, if activated.
- 3D Log Design
If you decide to include logs with this diagram ("Striplogs" setting, below), click on this button at the top of the window to set up how you want the 3D logs to look.
See Visible Item Summary and Using the 3D Log Designer for details.
- Model: Click on this tab to set up the modeling options.
- Input
- Data Source
- Data Columns:
- X (Easting), Y (Northing), Z (Elevation): Choose the datasheet columns where these input data are stored. These define the 3D location of the sample points.
- G (Dependent Variable): Choose the column in the datasheet that contains the value to be modeled. These can be any real number values.
- G-Value Filter: Activate this option to establish a data filter based on the measured values. Click this tab to set the filter parameters. (More info)
- Create Filtering/Resampling Report: Check this item if you have turned on any filters and want a report of the fulting results.
- Solid to be Created: Click to the right to enter a name for the solid model file (.RwMod) to be created.
- Algorithm: Click here to specify the modeling method to use, for creating a solid model from your irregularly-spaced XYZG data. (More info)
- Special Options: Click on this tab to establish other model settings, such as tilting, warping, filtering above-ground, and smoothing. (More info)
- Dimensions: Click here to establish the output dimensions (and node density) of the solid model. Unless there's a specific reason to do otherwise, you should probably leave the solid model dimensions set to the current project dimensions.(More info)
- 3D Solid Diagram
Check this item to create a 3D diagram representing the new solid model.
Click this tab to set up the diagram options.
- Block Diagram
- Isosurface: Click in the Isosurface radio button to display the solid model as if enclosed in a "skin." This view will be smoother than a voxel display. (More info)
- Isomesh: Check this box to plot a series of polylines that represent three-dimensional contours at a user-defined cutoff. Click this tab to establish the settings. (More info)
- Voxels: Click in the Voxels radio button to represent the solid model in the 3D display as color-coded voxels. You can choose to display either the Full Voxel, or just the Midpoint. Display of the midpoint only can significantly improve display time for huge models.
- Filter: Check this option if you want to restrict the isosurface or voxel display to a specific data range. This does not affect the model, only the display of the model. Enabling this permits you to create an initial display in RockPlot3D that eliminates the need to manually change the display attributes. More importantly, this capability if essential for initially displaying the solid in a pre-filtered state when creating animations and Playlist scripts.
! These filter settings can be changed once the diagram is displayed in RockPlot3D.
- Color Scheme: Choose the color scheme for the block model - automatic, table-based, etc. (More info)
-
- Other 3D Diagram Options
Use these checkboxes to append other layers to your 3D scene.
Click each tab to set up the 3D diagram layers (images, infrastructure, reference cage, etc.).
! If you are including Striplogs, be sure to click on the 3D Log Design button at the top of the window to define the log appearance.
- Output Options: Use these settings to define whether the output scene is to be saved (or displayed as "untitled"), how the file should be named, and whether it is to be displayed after it is created. It also offers export options. (More info)
- Access the RockWorks Datasheet program tab.
- Enter/import your X, Y, Z (elevations) and G data into the main RockWorks data sheet. Or, be sure an external text file exists, containing 4 columns of data (X, Y, Z, and G) to model.
! Click the Example button at the top of the window to load a sample file that is installed with the program.
- Click on the ModOps | Solid menu and choose the Create | XYZG - Solid option.
- Enter the requested menu settings, described above.
- Click the Continue button to proceed.
RockWorks will use the selected algorithm to create a solid model of the XYZG data. The completed model will be stored on disk under the indicated file name.
If you requested a diagram, the model will be displayed in a RockPlot3D tab in the Options window, using the requested display type.
- You can adjust any of the modeling or diagram settings in the main Options tab to the left and then click the Continue button again to regenerate the display.
- View / save / manipulate / print / export the model in the RockPlot3D window.
 Back to Solid Menu Summary

RockWare home page