Insert a check in this box to plot a series of polylines that represent three-dimensional contours at a user-defined cutoff. By plotting these lines in conjunction with an isosurface, a more distinct diagram is displayed.
Click on this tab to establish the Isomesh settings.
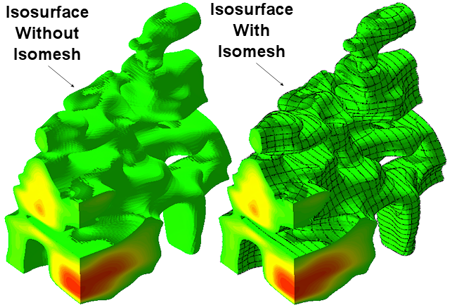
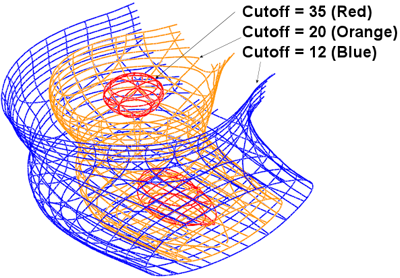
- Cutoff Level: This defines the contour interval that is represented by the lines within the Iso-Mesh. By itself, an isomesh isn't very pretty. When plotted in conjunction with an isosurface, however, and isomesh can produce dramatic results.
-
- Color: This defines the color that is used to plot the isosurface (see previous example).
- Thickness: This defines the line thickness that is used when plotting the isomesh isolines. A setting of "1" will generate thin lines, while a setting of "3" will generate thick lines.
- Smoothing: This defines the level of smoothing that is applied to the isolines (zero = no smoothing). The effect of smoothing is typically negligible except for extremely coarse models.
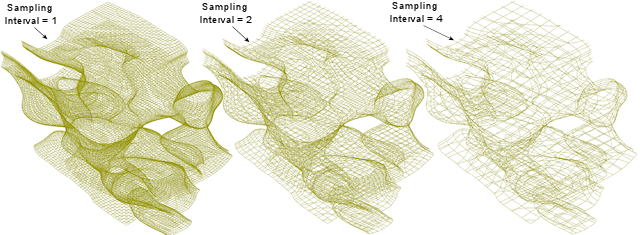
- Horizontal Sampling Interval: A setting of "1" will plot a contour for each layer within the solid model. A setting of "2" will skip every other layer, A setting of "3" will sample every third layer, and so on.
- Vertical Sampling Interval: The east/west and north/south profiles within an isomesh represent vertical slices of the block model. This setting tells the program how many rows to skip, similar to the Horizontal Sampling Interval.