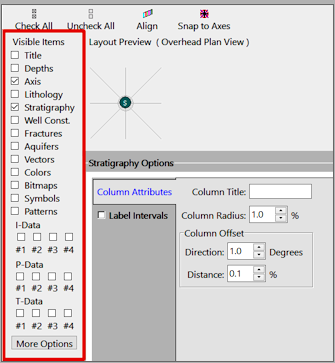
When you click on the RockWorks 3D Striplog Designer tab, you'll see a window where you can establish which data items will be displayed in the logs, their relative placement in the log, and their appearance settings. This topic discusses the Visible Items.
Visible Items Description, options Title Plots the borehole's name at the top of each log. The title is always plotted above the log axis. Options include font and offset. Offset Determines how far above the log the title will be plotted. The default is Automatic. If you expect to apply vertical exaggeration of 5x or more to your log or section, you might consider setting it to Manual, with a value of 0. Depths Plots depth labels down the logs. Settings include labeling interval, font style, etc.
(More info)Axis The axis is always on. It serves as the center point for the log, above which the main log title will plot (if activated). The location of the axis will represent the actual well location. Style Choose from a polyline or a 3D tube for the axis, and set the color and thickness (as a percent of the project size).
(More info)Lithology Plots a column in each log containing intervals of color that correspond to observed lithology material types. The color + rock type association is made in the Lithology Types Table. (Lithology patterns are not plotted in 3D logs, only the background color defined for the rock type.)
(More info)Stratigraphy Plots a column in each log containing intervals of color that correspond to formation depths. The color + stratigraphy name association is made in the Stratigraphy Types Table. (Stratigraphy patterns are not plotted in 3D logs, only the background color defined for the formation.)
(More info)Well Construction Plots a column in each log containing intervals of color that correspond to well construction material types. The color + material type association is made in the Well Construction Types Table. (Patterns are not plotted in 3D logs, only the background color defined for the material type.)
(More info)Fractures Reads measurements from the Fractures table and plots oriented discs representing the fracture dip direction and dip angle.
(More info.)Aquifers Plots one or more interval blocks (representing depth to surface and base declared in the Water Levels table) for all aquifers for selected dates in each log. Water level symbols and date/name labels can be included.
(More info)Vectors Reads Vector data and plots oriented arrow in your 3D logs, representing the azimuth bearing and the inclination.
(More info)Colors Reads entries from the Colors table and plots colored intervals in your 3D logs (cores, cuttings, etc.).
(More info)Bitmaps Plots downhole raster images in vertical 3D logs. Options include imbedding versus linking the image.
(More info)Symbols Plots user-selected symbols at specific depths in each log, as read from the Symbols table. These are commonly used to display water level symbols.
(More info)Patterns Plots user-selected color blocks between specific depths in each log, as read from the Patterns table. These are commonly used to show sampling intervals, screened intervals, and similar. (Note that the pattern designs themselves are not plotted in 3D logs, only the background color defined in the datasheet.)
(More info)I-Data #1,
I-Data #2,
I-Data #3,
I-Data #4


Plots a 3D bargraph representing data read from the I-Data table. Options include the data source, scaling, colors, style, etc. You can plot up to 4 I-Data columns.
(More info)T-Data #1,
T-Data #2,
T-Data #3,
T-Data #4


Plots a 3D bargraph representing data read from the T-Data table. Options include the data source, scaling, colors, style, etc. You can plot up to 4 T-Data columns.
(More info)P-Data #1,
P-Data #2,
P-Data #3,
P-Data #4


Plots a point to point curve or 3D discs in a 3D log, representing data read from the P-Data table. Options include the data source, colors, curve style, etc. You can plot up to 4 P-Data columns.
(More info)More Options General column options (label sizes, outlines, etc.)
(More info)
![]() Back to 3D Striplog Designer - Overview
Back to 3D Striplog Designer - Overview
![]()
