Use this program to:
! This is typically the first step in interpolating and visualizing your downhole I-data. Once you have a solid model that you believe represents your data well, you can use that existing .RwMod file for the other visualization tools in the I-Data menu (sections, fences, etc.).
See also
Creating an I-Data Statistics Map for a quick view of high/low/average values.
Feature Level: RockWorks Standard and higher
Menu Options
Step-by-Step Summary
Tips
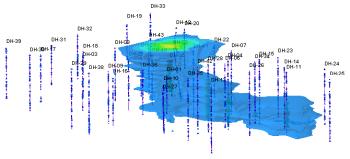
Follow these steps to create a 3D solid model of interpolated I-Data values, and/or to create a 3D block diagram illustrating this new model or an existing model:
If you've selected Use Existing Model, the program will load the information from the existing model (.RwMod file), and will proceed to diagram generation.
If you've selected Create New Model, the program will scan the project database and extract the XYZ points for all of the downhole measurements for the selected I-Data track. (For I-Data, the elevations will represent interval midpoints.) It will apply any source data filters you have requested.
The program will use the selected algorithm to create a solid model of the downhole interval data representing geochemistry, geotechnical measurements, etc. The completed model will be stored on disk under the indicated file name.
If you requested a diagram, the model will be displayed in a RockPlot3D tab in the Options window, using the using the requested display type. Any additional 3D layers that you have requested will be appended to the 3D scene.
! * If the I-Data model looks OK and you just need to adjust one of the diagram settings, you don't need to keep re-interpolating the model. Choose Use Existing Model and browse for the .RwMod file to be used for the 3D view.
![]() Back to I-Data Menu Summary
Back to I-Data Menu Summary
![]()