"XYZG" data can be entered into the RockWorks datasheet to represent X, Y, and Z location coordinates (easting, northing, and elevation) and a measured "G" value of some kind, such as geochemistry or geophysical measurements. This basic data layout can be run through the ModOps | Solid | Create | XYZG -> Solid for display as a 3-dimensional isosurface or block diagram. You can also display the XYZ points in 3D space (a 3D point-map) using the Utilities | 3-D | Points program.
! Use the Borehole Manager instead of the RockWorks datasheet if you have multiple downhole measurements for each well. See Entering the Borehole Data and its topics of I-Data, T-Data, and P-Data.
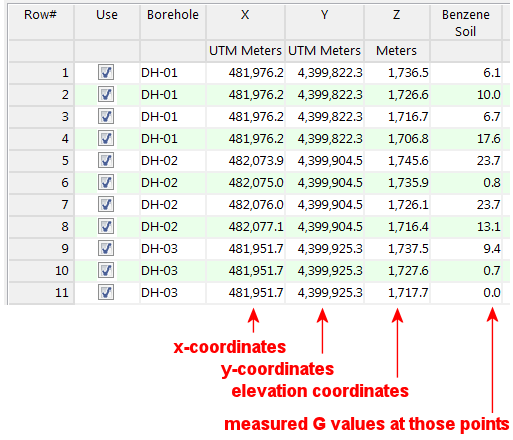
This example shows how you might enter X,Y,Z,G data into the RockWorks datasheet for modeling:
Column Summary
These columns are required:
- X (Easting), Y (Northing), Z (elevation) Coordinates: RockWorks must have location information in order to create a solid model. These units can represent feet or meters, local or global coordinates. See Defining your Datasheet Coordinates and Units for information.
- G values: This is the data that will be extrapolated into a continuous model of data using the Solid | Model program. You may list multiple G value columns if you wish. No-data entries can be indicated by leaving the cell blank or by entering a non-numeric value.
RockWorks can also create a solid model from a separate text XYZG file. In this case, no data is read from the RockWorks datasheet. Such a file can be exported from many software programs.
Notes:
- The XYZG file must be text in format and can be either space- or tab-delimited.
- Each row in the file must contain, at minimum, an X-value, a Y-value, a Z-value, and a G-value. Additional columns may be present within the file.
The X, Y, Z, and G value columns may be listed in any order within the file as long as they are consistent; RockWorks lets you specify which is which prior to solid modeling.
- The Z values must represent elevations.
- The X, Y, and Z values must represent the same units (e.g. all must be in feet or all in meters) if you wish to perform volumetric computations.
- The G values may represent any integer or real number value to be modeled.
- If a row in the file contains a colon (":") as its first character, then that line in the file will be ignored (handy for comments).
- No-data entries can be indicated by leaving the cell blank or by entering a non-numeric value.
Here's a simplified excerpt:
:X Y Z C1 C2
1225.0 1385.0 4455.0 - -
1225.1 1385.5 4450.0 - -
1225.3 1386.0 4445.1 - -
1225.4 1386.5 4440.1 - 26.0
1225.5 1386.9 4435.1 53.0 142.0
1225.7 1387.4 4430.1 97.0 296.0
1225.8 1387.9 4425.2 78.0 305.0
1226.0 1388.4 4420.2 10.0 362.0
1226.2 1389.0 4415.2 158.0 314.0
1226.6 1389.7 4410.3 188.0 281.0
1227.1 1390.4 4405.4 63.0 166.0
1227.6 1391.2 4400.5 108.0 78.0
1228.2 1391.9 4395.5 149.0 -
(etc.)
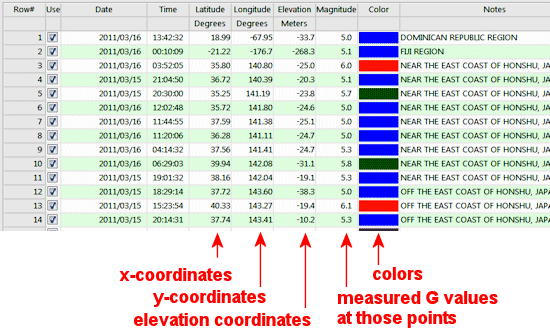
If you wish to display your XYZG data as 3D points, you can include additional, optional columns such as color.
Column Summary:
- X, Y, Z: Required. These assign easting, northing, and elevation coordinates for the spheres. These units can represent feet or meters, local or global coordinates. See Defining your Datasheet Coordinates and Units for information.
- Color: Optional. You can declare a unique color for each sphere, or they can be assigned a uniform color during processing.
- Magnitude: Optional. The program can scale the 3D points based on this column. In the example above, in which the spheres will represent earthquake epicenters, the Radius size will be taken from the Magnitude column so that the spheres will vary in size by quake size. (During processing, you can include a multiplier as well).
! RockWorks offers a variety of data layout suggestions, but you can organize your data columns any way you wish. During processing you can always specify which column contains which data. You can also add new columns as you wish.

RockWare home page