The Colored Intervals Scheme tab is used to access a variety of pre-set color schemes or to create your own, for use in 2D color-filled contour maps and in 3D surface maps, fence diagram panels, voxel models, and isosurfaces.
- Scheme
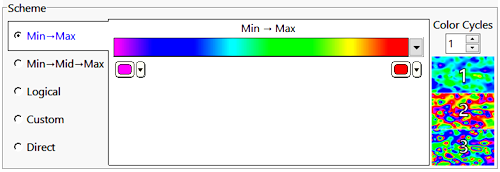
- Min - Max: This scheme grades colors between two end colors.
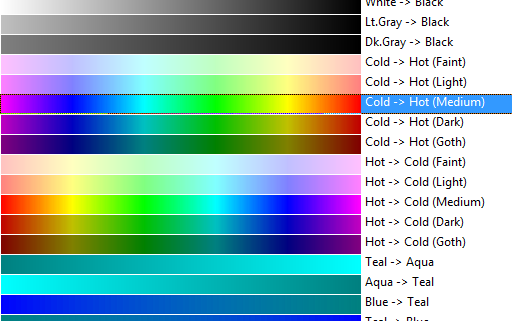
- Preset: You can click on the large color bar to select one of the many pre-set options.
-
- Manual: You can also click on the two small color boxes on either end to set your own end colors.
- Min - Mid - Max: This scheme grades between three colors.
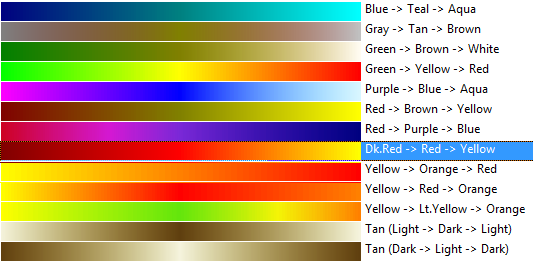
- Preset: You can click on the large color bar to select one of the many pre-set options.
-
- Manual: You can also click on the two small color boxes on either end to set your own end colors, and on the middle box to define the middle transition color.
- Logical: This scheme should be used only for "Boolean" grid models. This tells the program what color to use for "true" nodes (1's) and for "false" nodes (0's). Use the two color boxes to define the True and False colors.
- Custom: Choose this option to enter specific Z-value ranges and the colors that are to represent them in the colorfill map, 3D surface, or diagram. Select the name of the "Colorfill Table" that contains these values and colors. See Colorfill Tables for more information.
- Direct (Node Value = Color): Choose this option if the map or diagram represents a RockWorks color model, in which the interpolated node values represent actual Windows color integers. Using this option, RockWorks will create the diagram using the stored colors, rather than creating a gradational color scheme.
- Cycles: Use this option to create repeating cycles of the selected color gradation. For example, if you've requested a 2-color scheme and 2 cycles, the map would cycle twice through the beginning and ending color gradations.
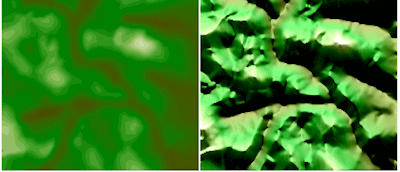
- Shaded Relief: (for 2D maps only) Check this box to add artificial lighting effects so that the two-dimensional contours appear more three-dimensional. The image below on the left has no relief shading (using a dark green to light green color scheme), and the image on the right has relief shading applied.
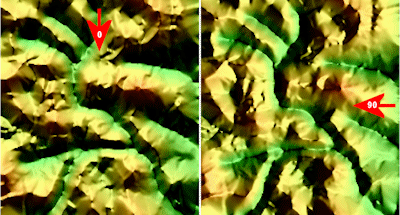
- Illumination Angle: This setting defines direction from which the illumination is based. The following examples shows illumination from the North ( 0 ) and East ( 90 ).
Note: The shaded relief setting has no effect upon the contours that are created by slicing through solid models (e.g. I-Data/Profile, P-Data/Profile, etc.).
-
- Intensity: Use this setting to define the amount of shading. Zero translates to no shading while 100 is completely white for slopes facing the illumination source.

RockWare home page