Create Vector (Cavern) Models

RockWorks | Borehole Operations | Vectors | Solid

Use this program to:

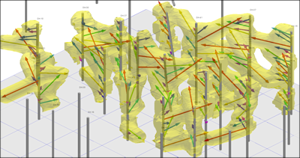
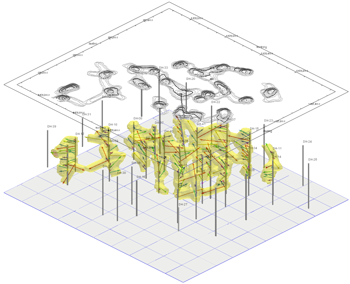
An example application is the generation of void geometries (cave models) based on downhole laser surveys. 3D logs can be included. The completed diagram will be displayed in a RockPlot3D window, where there is a variety of filtering and visualization options.

Feature Level: RockWorks Standard and higher


Menu Options
Step-by-Step Summary
Tips


  1. Access the RockWorks Borehole Manager program tab.
  2. Enter/import your data into the Borehole Manager, if you have not done so already. This tool specifically reads location, orientation (if any), and Vector data. The distance measurements would be recorded in the Value column.

  3. Select the Borehole Operations | Vectors | Solid menu option.
  4. Enter the requested program settings, described above.
  5. Click the Continue button to proceed.

    If you've selected Use Existing Model, the program will load the information from the existing model (.RwMod file), and will proceed to diagram generation.

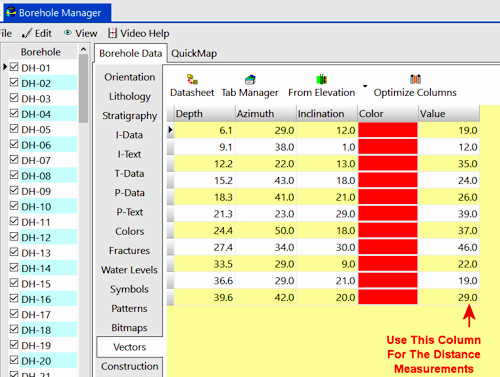
    If you've selected Create New Model, the program will scan the project database and extract the XYZ points for all of the downhole vector measurements.

    This program will perform the following operations in order to generate a model that approximates cave geometries based on the vector data:
    For each solid model node ...
       For each borehole ...
          For each vector ...
                Compute the endpoint coordinates.
                Define a line connecting the endpoints.
                Define a sphere whose center is defined by the line midpoint and whose diameter is equal to the line length.
                If the node resides outside of the sphere its g-value is set to "null" (-1.0E27).
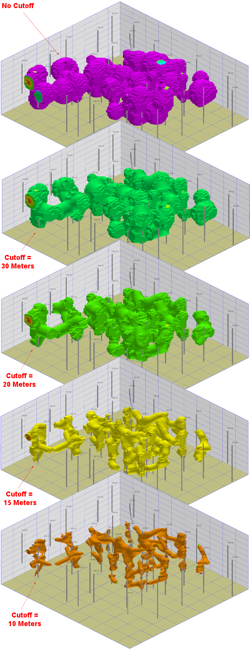
                If the node resides inside of the sphere, its g-value is set to the distance to the closest line.

    Note: In order for the node values to increase with distance to the closest line, it is necessary to negate the distance values (i.e. the node values should be multiplied by -1) as allowed within the Vector Modeling Options menu.

    The completed model will be stored under the indicated .RwMod file name.

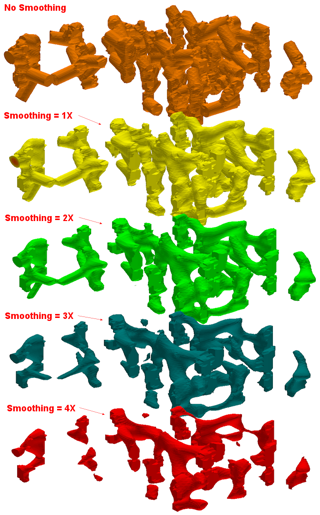
    If you requested a diagram, the model will be displayed in a RockPlot3D tab in the Options window, using the using the requested display type. Other layers will be appended to the scene as requested.

  6. You can adjust any of the modeling and/or diagram settings in the main Options tab to the left, and then click the Continue button again to regenerate the model and/or display.

    ! If the solid model looks OK and you just need to adjust one of the diagram settings, you don't need to keep re-interpolating the model. Choose Use Existing Model and browse for the .RwMod file to be used for the 3D view.

  7. View / save / manipulate / print / export the model in the RockPlot3D window.
  1. Once the modeling process has been completed, the initial diagram will be displayed in which the cave appears as a series of coalescing spheres. Experiment with the isolevel setting. During this process, notice how a highly filtered model will generate tubes around the laser paths. As a consequence, it is necessary that various cutoff levels be applied to achieve the desired diagram (e.g. cutoff = 25 meters). Note: If the "Negate Node Values" option was activated prior to the generation of the model (which it should have been), you will need to enter the isosurface cutoff value as a negative number.

  2. Change the opacity/transparency level of the isosurface to 50% in order to see into the model and compare the model with the original vector data.
    Save this diagram as "Caves.Rw3D".
  3. Convert the distance-to-point model to a boolean model by selecting the ModOps | Solid | Logic | Solid -> Boolean Solid program.
  4. Convert the boolean model into a grid model by selecting the ModOps | Solid | Extract Grids | Solid -> Grid program.

  5. Use the RockPlot2D | Export | RockPlot3D option to create an overlay of the contour map to show in conjunction with the 3D model.
  6. Once the diagram has been displayed within RockPlot3D, save it as "Contour Overlays.Rw3D".
  7. Use the RockPlot3D | File | Append option to append the caves diagram (caves.Rw3D) and the boreholes (boreholes.Rw3D).


Back to Borehole Manager Summary

RockWare home page