RockWorks | ModOps | Solid | Create | Images->Solid
Use this program to sample X/Y/Z/Color points from images listed within the RockWorks datasheet, and to then interpolate a solid color model using these points. The input data is the same as that required for the Vertical Images -> 3D Panels option.
Be warned: this process can be slow.
See also
Raster Formats for supported bitmap file types.
Vertical Panels -> X/Y/Z/Color option which extracts the X/Y/Z/Color points and lists them in a datasheet
Case Study: Creating a Solid Model from GPR (Ground Penetrating Radar) Profile Images
Feature Level: RockWorks Basic and higher
Menu Options
Step-by-Step Summary
- 3D Log Design
If you decide to include logs with this diagram ("Striplogs" setting, below), click on this button at the top of the window to set up how you want the 3D logs to look.
See Visible Item Summary and Using the 3D Log Designer for details.
- Data Columns: Use these prompts to define the input fields for the program.
- File Name: Select the name of the column in the current datasheet that lists the name(s) of the raster image(s) to be sampled and modeled.
Tip: use the File | Import | Create File List program to quickly create a list of specified file names.
- Layer Name: Select the column in which the layer names are listed. For this program, the layers are optional.
- X Lower-Left, Y Lower-Left, Z Lower-Left: Select the three columns in the datasheet that list the Easting, Northing, and elevation coordinates for the lower-left corner of the bitmap.
These can be defined in your project coordinates or other coordinate system. See Defining your Datasheet Coordinates for more information.
- X Upper-right, Y Upper-right, Z Upper-right: Select the three columns that list the Easting, Northing, and elevation coordinates for the upper-right corner of the bitmap.
- Model: Use these settings to tell the program whether you wish to use an existing color solid model (from a previous use of this tool or a Colors menu tool) or you wish to create a new color solid model, by clicking in the appropriate radio button.
! NOTE This is not trivial. Creating the model can take some time, depending on the resolution of the model and the detail of the images. If you already created a pleasing model, you can use the same model, which was stored in the project as an .RwMod file, for the 3D diagram.
- Create New Model: If want the program to interpolate a new model for the diagram, click in this radio button. Click this tab to establish the modeling settings.
- Solid to be Created: Click to the right to enter a name for the color model. The program will append automatically the file name extension .RwMod.
- Color Filter: Insert a check here to filter the input data based on color. (More info)
- Image Sampling: Converting every pixel to a control point will typically result in a control point array that is huge thereby creating memory and/or execution speed problems. The Sampling Intervals lets you create a reasonably-sized data set.
- Sampling Intervals
- By Pixel: Choose this option to resample the image by pixels.
- X (Horizontal) Sampling Frequency: This setting determines how often, on a horizontal/column basis, the image pixels will be sampled. For example, a setting of 1 will sample every pixel whereas a setting of 5 will cause the program to sample every fifth pixel across the image.
- Y (Vertical) Sampling Frequency: This setting determines how often, on a vertical/row basis, the image pixels will be sampled. For example, a setting of 1 will sample every row of pixels whereas a setting of 5 will cause the program to sample every fifth row.
- By Distance: Choose this option to resample the images by distance.
- Horizontal Distance: Enter the distance, in project units along the horizontal axis, at which the colors will be sampled.
- Vertical Distance: Enter the distance, in project elevation units along the vertical axis, at which the colors will be sampled.
- Ignore Specific Color: It may be desirable that certain colors be ignored when converting image pixels to control points for modeling. For example, if the input raster images had black borders and patterns this might create undesirable effects within the final model. This filter lets the program ignore any pixels that fall within a specified color range.
- Color: This is the color that will be ignored.
- Tolerance: Use this setting to broaden the ignored color: If black is the color that is to be ignored, for example, there may be pixels that are nearly black (e.g. dark gray). The tolerance setting provides a means for expanding the range of the filter to include colors that are similar to the desired color. Tolerance is defined as a percent, whereby "100" would include all colors, and "0" would include the selected color only.
- Algorithm: This determines the modeling method to use, for creating a solid model from your image color data. (More info)
- Special Options: Click on this tab to establish other model settings, such as tilting, warping, filtering above-ground, and smoothing. (More info)
- Dimensions: This determines the model density. (More info) Unless there's a specific reason to do otherwise, you should probably leave the solid model dimensions set to the current project dimensions.
- Use Existing Model: If you wish to display an already-existing color model, click in this radio button.
- Solid Model: Click on this item to browse for the name of the existing color model (.RwMod file) to be used for this block diagram.
- Create 3D Diagram
Check this item to create a 3D voxel diagram representing the new or existing solid model.
Click this tab to set up the diagram options. Note that, unlike some other 3D diagrams (which represent gradational models, for example), the voxel style is hard-wired to Voxels. Isosurface diagrams are not an option for color models.
- Striplogs: Append striplogs to your 3D scene. (More info)
- Draped Image: Include an image in this 3D scene, draped over an existing grid surface. (More info)
- Floating Image: Include an image in this 3D scene, floating at a specified elevation. (More info)
- Perimeter Cage Include a 3D reference cage around the solid diagram. (More info)
- Legends: Include one or more legends with the diagram.(More info)
- Infrastructure: Display buildings, pipes, or other infrastructure with your 3D scene. (More info)
- Faults: Include 3D fault ribbons with this scene. (More info)
- Other 3D Files: Include other, existing, RockPlot3D ".Rw3D" files in this scene. (More info)
- Output Options: Use these settings to define whether the output scene is to be saved (or displayed as "untitled"), how the file should be named, and whether it is to be displayed after it is created. It also offers export options. (More info)
- Access the RockWorks Datasheet program tab.
- Create a new datasheet and enter or import your listing of bitmap image names and their lower-left and upper-right real-world coordinates. These could be, for example, scanned images of 2D seismic or ground penetrating radar sections.
Or, open one of the sample files and replace that data with your own.
! Click the Example button at the top of the window to load a sample file that is installed with the program.
- Select the ModOps | Solid | Create | Images->Solid menu option.
- Enter the menu settings as described above.
- Click the Continue button to proceed.
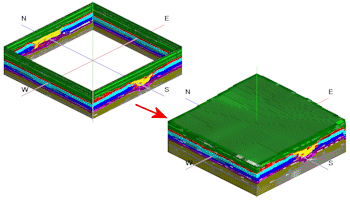
RockWorks will read the indicated bitmap image(s), and assign them the indicated coordinates in 3D space. It will then sample the image pixels at the requested intervals, storing the XYZ coordinate for the pixels and the color in memory.
It will then interpolate a solid color model using these sampled points. The resulting color model will be stored with an .RwMod file name extension in the project folder.
If you requested a diagram, the model will be displayed in a RockPlot3D tab in the Options window, using the actual Windows colors stored in the model.
- You can return to the menu settings via the Options tab to the left (such as color or sampling interval) and click the Continue button to regenerate model and/or 3D image.
! The color modeling process can be SLOW. If the color model looks OK and you just need to adjust one of the diagram settings, you don't need to keep re-interpolating the model. Choose Use Existing Model and browse for the .RwMod file to be used for the 3D view.
- View / save / manipulate / print / export the image in the RockPlot3D window.
 Back to Solid Menu Summary

RockWare home page