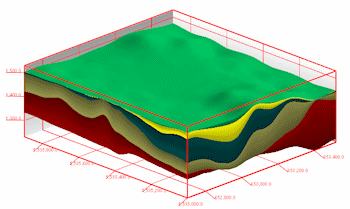
Use the Perimeter Cage button to access the settings which control the appearance of the 3D "reference cage" noting X, Y, and elevation coordinates. Note that many of the cage items can also be adjusted when displayed in the RockPlot3D window.
These options are also available as a stand-alone program (generating the perimeter cage only) in the Graphics | 3D Tools | Cage menu.
- Dimensions:
Click on this tab to establish whether the reference cage dimensions are to be determined automatically by the program, or entered manually by the user.
- Intervals
Click on this tab to establish the grid and label intervals.
- Horizontal (XY) Intervals: Choose Automatic to have the label interval assigned automatically. Choose Manual to enter the labeling interval in your output XY map units.
- Vertical (Z) Intervals: Choose Automatic to have the label interval assigned automatically. Choose Manual to enter the labeling interval in your output elevation units.
- Panels
Click on this tab to define which panels will be visible.
- Panels: West
 , East , South , North , Base , Top : Insert a check in any of these items to display a filled panel along the indicated axis. The graphic cartoon will be updated as you turn panels on/off. Note that you can turn the solid panels on and off in the RockPlot3D display, and you can also adjust the panel transparency there.
- Color: Select the color for the fill for each panel using the small color box.
- All Panels: On / Off: You can use these buttons to quickly turn on or off all the solid-fill panels.
- Grids
Click on this tab to set up grid lines on each axis.
- West , East , South , North , Base , Top : Insert a check in any of these items to display grid lines along the indicated axis. The graphic cartoon will be updated as you turn grids on/off. You can plot panels with or without grids. You can plot grids with or without panels.
- Line Style/Color: Click on the line sample to select a line style, thickness, and color for the grid lines. The selection will apply to all activated grids.
- All Grids: On / Off: You can use these buttons to quickly turn on or off all of the panel grids.
- Axis Labels
- Corners: Southwest , Northwest , Northeast , Southeast : Insert a check in any of these items to display coordinate labels along the indicated vertical axis. The cartoon will be updated with the activated items.
- Top: West , East , South , North : Insert a check in any of these items to display coordinate labels along the indicated side of the top panel or grid. The cartoon will be updated with the activated items.
- Base: West , East , South , North : Insert a check in any of these items to display coordinate labels along the indicated side of the base panel or grid. The cartoon will be updated with the activated items.
- All Labels: On / Off: You can use these buttons to quickly turn on or off all of the axis labels.
- Font: Click on this button to select the font style, size and color for the labels. The setting will apply to all active axis labels.
- Offset: This setting defines how far from the axis itself the labels will be displayed, expressed as a percent of the diagram width. A setting of "2" will place the labels close to the boundary lines, while a setting of "6" will place the labels further away from the lines. (default = 3)
- Leader Lines: Insert a check here to connect the reference labels to the cage. The thickness will be the same as that set for the reference lines, above. The color will match the font color.
- Decimals
Click on this tab to define the decimal places in the labels.
- Horizontal (XY) Decimals: Select the decimal places to be used for the X and Y coordinate labels - you can have the program determine this Automatically or define them Manually.
- Vertical (Z) Decimals: Select the decimal places to be used for the axis labels - you can have the program determine this Automatically or define them Manually.

RockWare home page