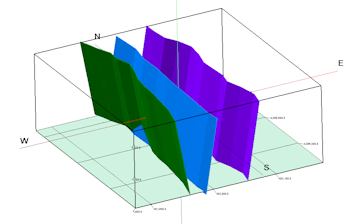
3D fault meshes and/or polylines are offered as a layer for many 3D diagrams. They are typically plotted to illustrate fault locations which have been applied to solid models or surface models. The fault location information is read from the enabled faults in the Faults tab in the main RockWorks program window.
- Faults: Insert a check in this option to include 3D fault mesh and/or polylines as a diagram layer, representing the enabled faults in the Faults program tab.
- Plot Faults as 3D Triangle Meshes: Check this box to display the fault(s) as 3D triangles. You can activate both this and the polylines, below.
- Plot Lines along Triangle Edges: If you have requested 3D triangle mesh display, you can check this box if the outlines of each triangle comprising the mesh are to be displayed. The perimeter color will correspond to the color defined for the fault in the Faults tab.
- Fill Triangles within Fault Mesh: Check this option to fill the triangles with the fault color.
- Triangle Thickness: Specify the thickness of the solid triangles in project units.
-
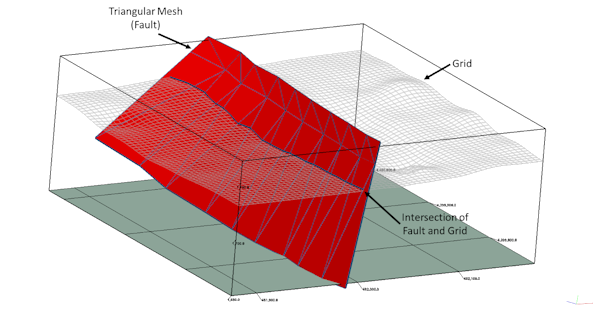
- Plot Fault / Grid Intersections as Lines: Check this option to plot a 3D line at the intersection of the Fault Surface and an RwGrd file. The line style and color are defined in the Faults tab.
- Grid: Browse for the name of the RwGrd file.
- Vertical Offset: Enter a vertical offset value, in your project units, to offset the line above or below the actual intersection line, for visibility.
- 2D Fault Elevations: Define the 2D (vertical) fault elevations for display in 3D.
- Automatic: Choose this for the 2D fault to extend from the lowest to highest elevation defined in your project dimensions.
- Manual: Choose this to enter the base and top elevations into the prompts. This will apply to all enabled 2D faults in the Faults tab.

RockWare home page