RockWorks | Graphics | Images | Vertical | Multiple
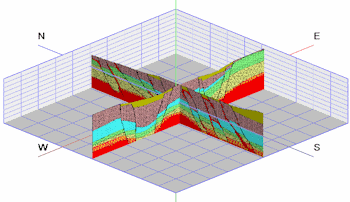
Use this program to display vertical images - representing hand-drawn sections, seismic sections, GPR profiles, etc. - as straight panels in three dimensions.
Feature Level: RockWorks Basic and higher
Menu Options
Step-by-Step Summary
- Rules & Filters
Use the tabs at the top of the window to apply spatial filters, time/date filters, or stratigraphic rules to data being displayed in your 3D logs, if activated. (More info)
- 3D Log Design
If you decide to include logs with this diagram ("Striplogs" setting, below), click on this tab at the top of the window to set up how you want the 3D logs to look.
See Visible Item Summary and Using the 3D Log Designer for details.
- Data Columns: Use these prompts to define the names of the columns in the current datasheet which contain the input data.
- File Name: Select the column that lists the name(s) of the raster image(s) to be shown on panels.
Tip: use the File | Import | Create File List program to quickly create a list of specified file names.
- Layer Name: Select the column in which the layer names are listed. These will simply be used to label the panels in RockPlot3D.
- X Lower-Left, Y Lower-Left, Z Lower-Left: Select the three columns in the datasheet that list the Easting, Northing, and elevation coordinates for the lower-left corner of the raster image.
These can be defined in your project coordinates or other coordinate system. See Defining your Datasheet Coordinates for more information.
- X Upper-right, Y Upper-right, Z Upper-right: Select the three columns that list the Easting, Northing, and elevation coordinates for the upper-right corner of the bitmap.
-
- Panel Options
- Set Transparent Color: Check this item if you want to specify a specific color in the bitmap images to be displayed transparent. Click the color box to choose that color.
For example if the images have a white background and you would like that part to be see-through, you would select white. This will be applied to all of the images.
- Other 3D Diagram Options
Use these checkboxes to append other layers to your 3D scene.
Click each tab to set up the 3D diagram layers (striplogs, reference cage, infrastructure, etc.).
- Output Options: Use these settings to define whether the output graphic is to be saved (or displayed as "untitled"), how the file should be named, and whether it is to be displayed after it is created. It also offers export options. (More info)
- Access the RockWorks Datasheet program tab.
- Create a new datasheet and enter or import a listing of bitmap image names and their lower-left and upper-right real-world coordinates. These could be, for example, scanned images of 2D seismic or ground penetrating radar sections.
Or, open one of the sample files and replace that data with your own. See Data Layout for datasheet examples.
! Click the Example button at the top of the window to load a sample file that is installed with the program.
- Select the Graphics | Images | Vertical | Multiple menu option.
- Enter the settings as described above.
- Click the Continue button to proceed.
The program will read the indicated raster image(s), assign them the indicated coordinates, and (if requested) display them as vertical panels in a RockPlot3D tab in the Options window.
- You can adjust any of the options along the left (such as transparent color) and click the Continue button to regenerate the 3D scene.
- View / save / manipulate / print / export the image in the RockPlot3D window.
 Back to Image Menu Summary

RockWare home page