Use this program to:
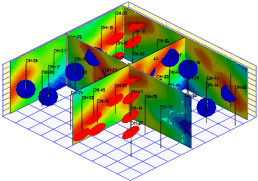
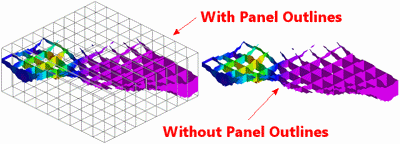
You may request regular panel spacing, in a variety of configurations, or you can draw your own panels. The data values can be color-coded in a variety of ways; 3D logs and other layers can be appended. The completed fence diagram will be displayed in RockPlot3D where there is a variety of visualization tools.
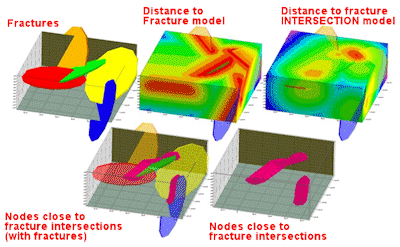
Unlike P-Data, T-Data and I-Data models, Fracture models are created using a specialized modeling algorithm that represents distance to fractures.
Feature Level: RockWorks Standard and higher
Menu Options
Step-by-Step Summary
If you've selected Use Existing Model, the program will load the information from the existing fracture model (.MOD file) and proceed to diagram generation.
If you've selected Create New Model, RockWorks will scan the project database and extract the XYZ points for all of the downhole fracture measurements, applying any input data filters.
The program will use its dedicated fracture-proximity algorithm to create a solid model of the distance to fractures or the distance to fracture intersections (as requested) in the project. The completed model will be stored on disk under the indicated file name.
If you have requested "Negate Values" then the distances will be multiplied by "-1" so that large distances will become very large negative numbers.
RockWorks will then look at the coordinates specified for each fence panel and determine the closest nodes along the cuts in the brand-new model, if created, or in the existing model. It will construct a vertical profile to illustrate the data values. This process will be repeated for each fence panel you drew. If strip logs were requested, the 3D logs will be appended to the 3D diagram, along with any other requested diagram layers. The completed diagram will be displayed in a RockPlot3D tab in the Options window.
! If the solid model looks OK and you just need to adjust one of the diagram settings, you don't need to keep re-interpolating the model. Choose Use Existing Model and browse for the .RwMod file to be used for the fence.
![]() Back to Fracture Menu Summary
Back to Fracture Menu Summary
![]()