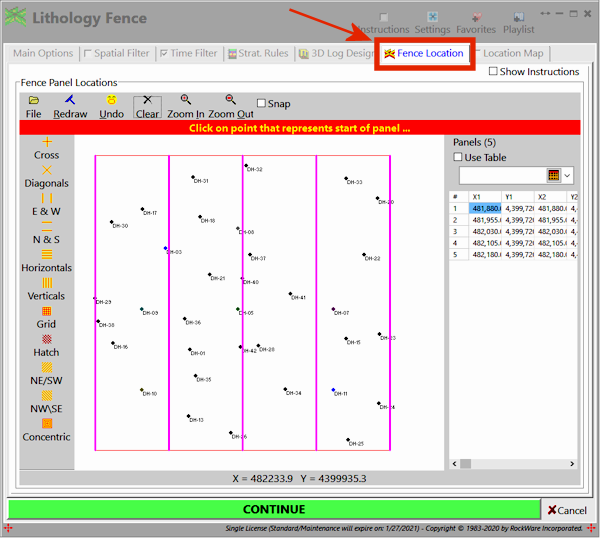
It will display the well locations in the Fence Diagram Configuration window as a plan-view map, with boring name and symbol color tied to each well. Any previous lines drawn for this project will also be displayed on the map.
- First, to snap the panel endpoints to actual well locations, insert a check in the Snap check-box (above the map). After you select the panel endpoint pairs, they will be repositioned to the nearest boreholes.
- Lithology, modeled stratigraphy, I-Data, T-Data, P-Data, Fracture, Aquifer, and Color fence panels can lie between boreholes - the slices can be placed anywhere within the model.
- Straight stratigraphy fences must be drawn borehole to borehole, and the program will automatically snap panel endpoints to well locations.
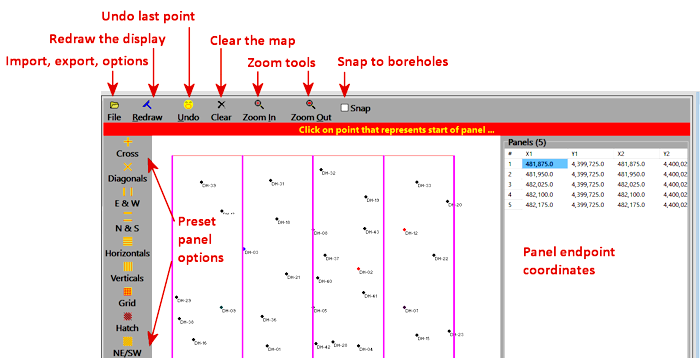
- Manually draw the line: Simply left-click on the map location to become the one edge of the panel and then left-click on the location to become the other edge of the panel. The program will connect the points with a line.
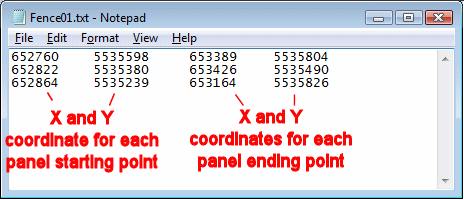
Repeat the process for the next panel, which can be connected to this one, or not. Note that the program will display a prompt to "Click on panel starting-point" or "Click on panel end-point" to let you know where you're at. As you click to define the fence panel endpoints, the coordinates will be displayed in the table to the right.
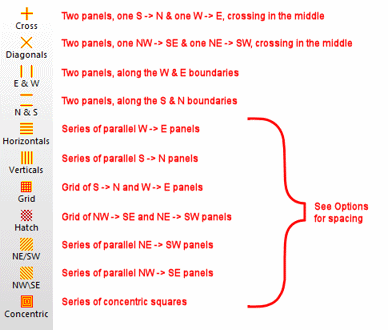
- Pre-configured panels: Another option for fence panels is to select a pre-configured panel arrangement by choosing an option from the menu displayed to the left of the selection map. For example, for an automatic X-shaped panel layout that extends to the edge of the model, click the Diagonals option. For equally spaced East-West panels, click the E & W option. You can select multiple arrangements.
The different panel layouts are shown below. As mentioned above, the slices do not need to conform to borehole locations for projected fence panels. They do for hole to hole fences (Stratigraphy menu) and the program will snap the drawn endpoints to the closest boreholes. See Options for information about the number of panels that will be created.