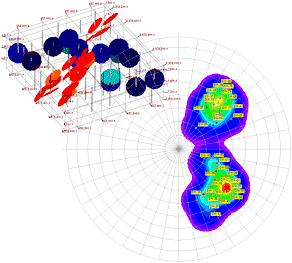
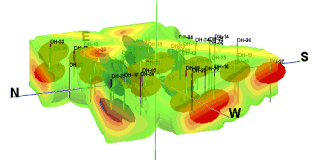
3D Solid: A 3D isosurface or voxel display of the interpolated block model. (More info)
2D Profile: Create a profile diagram sliced between two points in the solid fracture model, with projected striplogs, and color/contour fills. (More info)

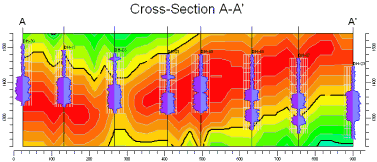
2D Multi-Panel Cross Section: Create a 2D multi-panel cross section, sliced between multiple points in the solid fracture model, with vertical striplogs at panel edges, and color/contour fills. (More info)
2D Multi-Panel Cross Section with Projected Logs: Create a 2D multi-panel cross section, sliced between multiple points in the solid fracture model, with striplogs projected onto panels, and color/contour fills. (More info)
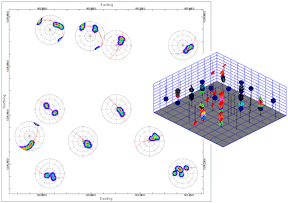
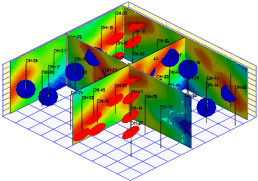
Fence: Create a 3D multi-panel fence diagram, sliced between multiple points in the solid fracture model, with 3D logs and color fills. (More info)
Surface Map: Create a map representing the interpolated values where the solid fracture model intersects a designated surface (.RwGrd file). (More info)
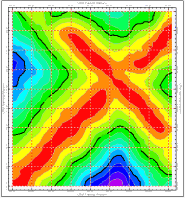
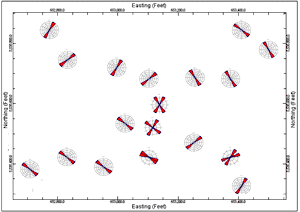
Plan Map: Create a map representing the interpolated values where the solid fracture model intersects a horizontal plane. (More info)