RockWorks | ModOps | Grid | Create | XYZ -> Grid
This program is used to:
- Create a grid model (.RwGrd file) of XYZ data in the Utilities datasheet or in an external ASCII file, and/or
- Create a 2-dimensional (flat) map and/or 3-dimensional surface map representing the grid model.
RockWorks offers several different methods to compute the grid model and many different map settings.
See also
Displaying Grid Models to generate a map from an existing grid model (.RwGrd file).
Feature Level: RockWorks Basic and higher
Menu Options
Step-by-Step Summary
- Rules & Filters
Use the buttons at the top of the window to apply spatial filters, time/date filters, or stratigraphic rules to data being displayed in your map. (More info)
- 3D Log Design
If you decide to include logs with this diagram ("Striplogs" setting, below), click on this button at the top of the window to set up how you want the 3D logs to look.
See Visible Item Summary and Using the 3D Log Designer for details.
- Grid Model
- Data Source
- Datasheet: Choose this option if the program is to read the input data from the current Datasheet.
- X (Easting): Select the column in the main datasheet that contains the X or Easting coordinates to be modeled and mapped.
These can be Eastings in meters or feet, decimal longitudes, etc. See Defining your Datasheet Coordinates for more information.
- Y (Northing): Select the column that contains the Y or Northing coordinates.
- Z (Elevation): Select the column that contains the Z values to be modeled and represented in the contour map. The Z values can be any measured values, such as elevation, quantitative values (geochemistry), qualitative values, percents, etc.
- ASCII File: Choose this option if the data to be gridded is stored in an external text file.
! This can be helpful if you have a large amount of data to be gridded - it's faster to read the data from an external file than to load it into the program's datasheet.
! You cannot include Symbols or Labels for points loaded from an external file.
! RockWorks assumes the units in the external file are the same as your Output Units.
Click on this tab to specify:
- ASCII (Text) File: Click here to browse for the name of the external ASCII text file that contains the data to be gridded.
- Data Columns:
- X-Column, Y-Column, Z-Column: Click on each prompt to specify the column position in the external file for the specified data to be gridded. For example, if the X-coordinates are stored in the first column in the file, you would enter: 1
- Delimiter Click here to specify whether the columns in the file are separated by spaces, tab characters, or other delimiting characters.
- Spatial Filter: Check this box to apply a spatial (X, Y, Z) filter to the input data being gridded. (More info.)
- Grid to be Created
- Grid Model Output File: Click to the right to enter the name for the new grid model. Use ".RwGrd" as the file name extension.
- Dimensions: Click this tab to view/change the dimensions (extents and node spacing) of the grid model. (More info.)
- Algorithm: Click this tab to choose the gridding method that will be used to interpolate the grid model. (More info.)
- Options: Click this tab to access the various gridding options such as smoothing, declustering, etc. (More info.)
- 2D Grid Map
Check this box to display the output grid as a 2D map at this time.
Click this tab to set up the 2D map layers (bitmap, symbols, labels, line contours, color-filled contours, labeled cells, map border, etc.).
- Output Options: Use these settings to define whether the output graphic is to be saved (or displayed as "untitled"), how the file should be named, and whether it is to be displayed after it is created. It also offers export options. (More info)
- 3D Grid Diagram
Check this box to display the output grid as a 3D surface at this time.
Click this tab to set up the 3D map layers (surface colors, images, reference cage, etc.).
! You can request both a 2D and 3D representation of the grid model.
- Output Options: Use these settings to define whether the output scene is to be saved (or displayed as "untitled"), how the file should be named, and whether it is to be displayed after it is created. It also offers export options. (More info)
- Be sure you've got the source data ready:
- Datasheet: Create a new datasheet and enter or import the location coordinates for the sites to be displayed in the map, and the z-value column to be contoured. (More info) Or, open one of the sample files and replace that data with your own. ! Click the Example button at the top of the window to load a sample file that is installed with the program.
Or...
- External file: Be sure the external ASCII XYZ file exists.
- Select the ModOps | Grid | Create | XYZ - Grid menu option.
- Enter the requested menu settings, described above.
- Click the Continue button to proceed.
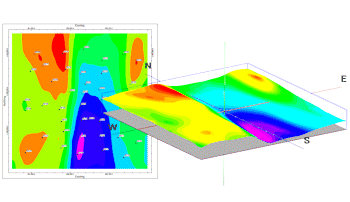
The program will create a new grid model and, if requested, create a 2- or 3-dimensional image representing the grid model. The requested diagram(s) will be displayed in a RockPlot2D tab and/or RockPlot3D tab in the Options window.
- You can adjust any of the settings via the Options tab to the left, and then click the Continue button again to regenerate the grid model and/or diagram(s).
- View / save / manipulate / export / print the diagram in the RockPlot2D or RockPlot3D window.
Back to Grid Menu Summary
RockWare home page