RockWorks offers the following layer options for two dimensional grid-based maps. A layer will be generated if a check-mark is displayed in its check box. To access the item's setting, click on its tab in the RockWorks program window.
Click on a picture or link below for more information.
|
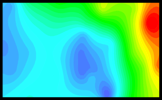
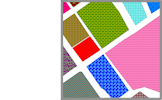
Color Intervals: Plot solid color-filled regions representing the distribution of z-values in the study site. |
|
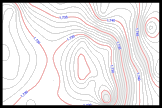
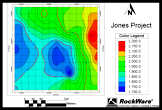
Contour Lines: Plot lines representing the distribution of "z-values" (elevation, geochemistry, etc.) in the study site. |
|
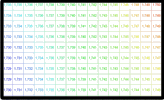
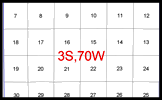
Labeled-Cells: (Available only for grid-based maps.) Draw a grid of lines corresponding to the grid model nodes, and fills the cells with labels for the node values. |
|
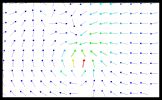
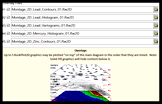
Gradient Vectors: (Available only for grid-based maps.) Displays small arrows between grid nodes to represent uphill or downhill gradients. |
|
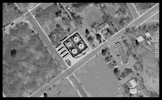
Background Image: Displays a raster image in the background of the other map layers. |
|
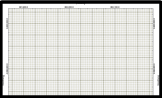
Labeled Axes: Plot border tick marks and coordinates labels, and axis titles. |
|
Map Overlays: Access a suite of point, polyline, borehole, infrastructure, land grid, and polygon map layers, listed below. |
|
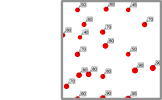
Point Symbols: Illustrate sample locations in the datasheet with map symbols and/or labels. |
|
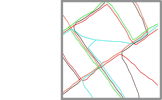
Faults: Illustrate faults with polylines. |
|
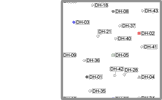
Borehole Locations: Illustrate the borehole locations with map symbols and/or labels. |
|
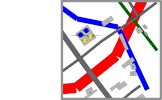
Infrastructure: Create a plan-view map layer of building, road, pipe, and other infrastructure locations read from a text file. |
|
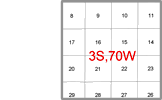
US Public Land Grid: Create a map layer with Range/Township/Section boundaries. |
|
Polygons: Create a map layer with one or more polygons (property boundaries, etc.) |
|
Other 2D Files: Add up to 5 existing Rockplot2D files to your new map or diagram, such as a base map layer on a new contour map. |
|
Peripherals: Add a north arrow, scale bar, logo, title block, legend, and more to your map or diagram. |
|
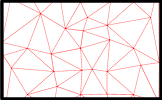
Triangulation Network: (Available only for Triangulation Contour maps only.) Displays the network of triangles constructed by the program to build the map contours. |
![]()