"XYZ" data can be entered into the RockWorks datasheet to represent X and Y location coordinates and a measured "Z" value of some kind, such as elevations or geochemistry. This basic data layout can be run through the Utilities | Maps | Point Symbols to create a simple point map or through Maps | Triangulation Contours to generate a line/color-filled contour map. Or, you can create a grid model of the XYZ data (ModOps | Grid | Create | XYZ->Grid) for display as a 2D contour map or 3D surface. XYZ data can also be displayed in Google Earth using the Utilities | Earth programs.
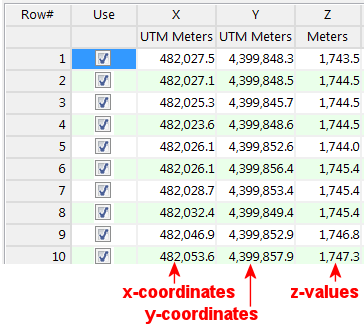
This example shows an XYZ file that lists only:
- X (Easting), Y (Northing) Coordinates: Required. The program must have location coordinates in order to build a map. These may represent a local coordinate system, or a global coordinate system such as UTM or longitude/latitude. See Defining your Datasheet Coordinates and Units for information.
- Z-Values: Required for contour maps and 3D surface maps; you must have at least one column of Z-values for these map types. Z-values may represent surface elevations (as above), geochemical values, ratings for Mexican restaurants, or virtually any measured value. No-data entries can be indicated by leaving the cell blank or by entering a non-numeric value.
- ID (sample name or number). Used to label individual points in point maps.
- Symbol & color: Used to specify unique symbols for point maps or global maps.
- Multiple Z-Values: These geochemical concentrations could be illustrated in contour maps, as proportional symbol point maps and multi-variate maps, histogram plots, ternary diagrams, and more.
! RockWorks offers a variety of data layout suggestions, but you can organize your data columns any way you wish. During processing you can always specify which column contains what data.
- Grid_Create_XYZ.RwDat
- Maps_Soil_Properties.RwDat
- Maps_Surface_Geochemistry.RwDat

RockWare home page