RockWorks | Utilities | Maps | Triangulation Contours
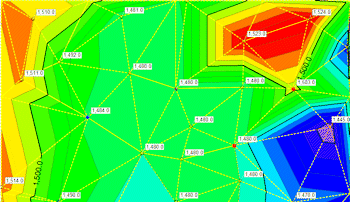
This program is used to build 2-dimensional contour maps for X, Y, and Z coordinate data listed in the RockWorks datasheet. Line and color contours will be drawn using the Delaunay Contouring method, they are not based on an interpolated grid model. Additional map layers include the triangulation network that was used to build the contours, point symbols and labels, border annotation, images, and more.
! For 3D triangulation-based surfaces, see the Utilities | 3-D | Triangulation Surface program.
! For maps and 3D surfaces based on grid models, see the Grid | Create | XYZ - Grid program.
Menu Options
Step-by-Step Summary
- Spatial Filter: Insert a check in this box at the top of the program window to activate a data filter based on spatial coordinates. Click this button to enter the filter settings. Click the Return to Previous Menu button when you are done entering the filter settings. (More info)
- Time Filter: Insert a check in this box at the top of the program window to filter the borehole Aquifer or T-Data based on date/time. This only applies to the Borehole Locations overylay layer, if activated. Click this button to enter the filter settings. Click the Return to Previous Menu button when you are done entering the filter settings. (More info)
- Data Columns
Click this tab to define the datasheet input columns.
- X (Easting): Select the name of the column in the main datasheet that contains the X or Easting coordinates.
These can be Eastings in meters or feet, decimal longitudes, etc. See Defining your Datasheet Coordinates for more information.
- Y (Northing): Select the column that contains the Y or Northing coordinates.
- Z (Elevation): Select the column that contains the numeric "Z" values (elevation, concentration, etc.) to be contoured.
- Triangulation Contours
- Contours: Click this tab to set up the line and/or color contour layer.
- Colored Intervals: Check this to include color-filled contours to represent the data in the selected Z column. Click this tab to access the color-contour options.
- Contour lines: Check this to include line contours to represent the data in the selected Z column, above. Click this tab to access the contour options.
! Line and color contours will be drawn using the Delaunay Contouring method.
- Triangle Network: Check this box to include the network of triangles that the program will construct to build the map contours.
- Interpolate Edge Points: If activated, this setting will force the program to insert points along the edge of the study area so that the contours can be drawn to the edge. It does this by inserting 5 points at equal spacing along the map boundaries (with one in each corner) and assigning them a value using the Inverse-Distance squared method. These new points can then be used when drawing the triangle network, assuring that all edges and corners are included within the network. See Delaunay Contouring for more information.
-
- Map Layers: Select the layers you wish to incorporate into the map, inserting a check-mark in those you wish to include. Establish the settings for each activated layer, such as a background image, axis labels, etc. See 2D Map Layers for more information.
- Output Options
- Save Output File: Check this to assign a name for the map in advance, rather than displaying it as Untitled.
- Automatic: Choose this option to have RockWorks assign the name automatically. It will use the name of the current program plus a numeric suffix, plus the ".Rw2D" file name extension.
- Manual: Choose this option to type in a name of your own for this file.
- Display Output: Check this option to have the resulting map displayed in RockPlot2D once it is created.
- Access the RockWorks Datasheet program tab.
- Create a new datasheet and enter or import the location coordinates and z-value column to be contoured.
Or, open one of the sample files and replace that data with your own. See Data Layout for datasheet examples.
! Click the Example button at the top of the window to load a sample file that is installed with the program.
- Select the Utilities | Map | Triangulation Contours menu option.
- Establish the menu settings as described above.
- Click the Continue button to create the map.
The program will create the map with the selected layers, and display the map in a RockPlot2D tab in the Options window, if requested.
- You can adjust any of the mapping options along the left and click the Continue button to regenerate the map.
- View / save / manipulate / print / export the map in the RockPlot2D window.
 Back to Map Menu Summary

RockWare home page